Pi Network price prediction is back in focus as $PI shakes off a liquidity sweep below its ascending trendline and starts climbing again, with that same trendline now acting as support. Sweep
Pi Network price prediction is back in focus as $PI shakes off a liquidity sweep below its ascending trendline and starts climbing again, with that same trendline now acting as support.
Sweeps like this often clear out weak hands before the real move begins, and the way $PI has bounced back suggests buyers were waiting right where the chart needed them.
Layer in some fresh ecosystem news, and there is a decent amount to unpack here. Here is the full picture.
Pi Network Price Today: Live Data and 24-Hour Change
PI is trading at $0.09195 at the time of writing, up a modest 0.71% over the past 24 hours.
Market cap sits at $1.02 billion, up 0.8%, while 24-hour volume has dropped sharply to $4.6 million, a decline of 27.94%, putting the volume-to-market-cap ratio at just 0.4514%.
Fully diluted valuation stands at $9.18 billion, with total and max supply both fixed at 100 billion $PI, while circulating supply currently sits at 11.11 billion $PI.
Source: CoinMarketCap data snapshot, August 29, 2026.
Pi Network Latest News and Catalyst
There is a real development sitting behind this PI price forecast.
According to a post from BSCN, the $Pi Core Team has officially integrated OpenClaw and the Atlassian MCP Server into the SoloHost framework on $Pi Desktop.
OpenClaw gives Pioneers access to a local AI environment, while the Atlassian MCP Server brings AI-powered Jira project management into the mix.
The post frames this as a meaningful shift for the network, marking the transition of 420,000 active nodes from pure blockchain validation toward functioning as decentralized physical infrastructure, or DePIN.
Developer tooling news like this does not guarantee a price reaction, but it does add a layer of fundamental support to the current setup.
Source: BSCN on X, August 28, 2026, 9:14 PM.
Quick Take
CMP: $0.09195 on the 1-hour OKX perpetual chart
Bullish trigger: 1 hour close above $0.09387 needed to confirm continuation off the trendline support
Bullish continuation levels: $0.10409, then $0.11100
Bearish trigger: 1 hour close below $0.08785
Bearish target on breakdown: $0.08129
Data timestamp: August 29, 2026, 15:50 UTC+5:30
Risk note: Price just swept liquidity below this trendline before bouncing, so a closing break is more meaningful here than a simple wick through either level
Pi Network Technical Analysis August 2026
The 1-hour PI/USDT perpetual chart on OKX shows price recently sweeping liquidity just below its ascending trendline before reclaiming that trendline as support and moving higher.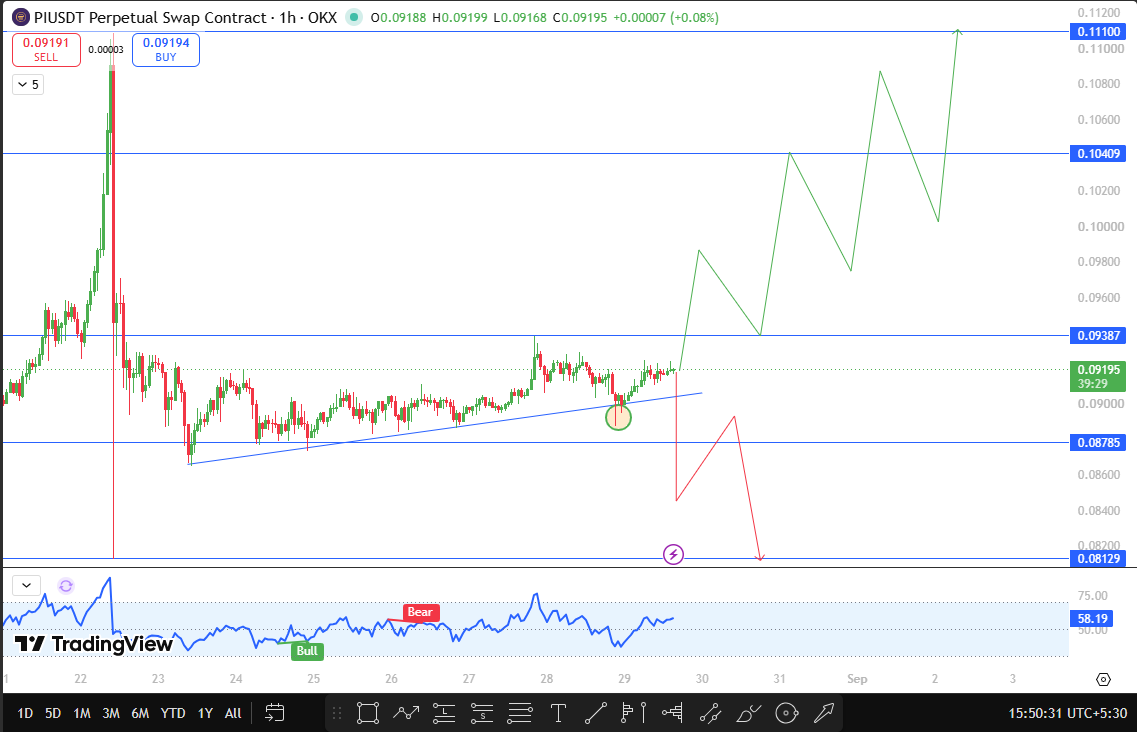
This kind of move, a quick dip through a key level followed by a fast recovery, often signals that stop losses got cleared out before real buying stepped back in, and the strength of the bounce here supports that read.
If price continues building on this and closes above $0.09387 on the 1-hour chart, that would be the first confirmation this trendline support is holding with conviction.
A close beyond that level opens the path toward $0.10409, and if momentum keeps building, $0.11100 becomes the next objective in this Pi Network price prediction.
On the downside, if price fails to hold the trendline and closes below $0.08785 on the 1-hour timeframe, that would point to the liquidity sweep failing to hold as support. In that scenario, the next level to watch drops to $0.08129.
Given how sharply $PI reacted off the sweep, a similarly sharp move could play out again if this trendline gives way.
Source: TradingView, PI/USDT Perpetual Swap, 1-hour chart, OKX, August 29, 2026, 15:50 UTC+5:30.
PI Support and Resistance Levels
Level Type
Price
Note
Resistance 2
$0.11100
Extended upside target
Resistance 1
$0.10409
Recent swing high
Confirmation Level
$0.09387
Needed to confirm trendline continuation
Current Price
$0.09195
CMP on 1-hour chart
Support 1
$0.08785
Trendline support zone
Support 2
$0.08129
Deeper support level
Bull, Base, and Bear Case for PI
In the bull case, price holds the trendline, closes above $0.09387, and pushes toward $0.10409 with $0.11100 as the extended target if buying pressure continues.
The base case has price consolidating just under $0.09387 for a bit longer as the market digests the recent liquidity sweep before committing to a clear direction.
In the bear case, Price loses the trendline and closes below $0.08785, and the price works its way toward a retest of $0.08129.
Risks to This Pi Network Price Prediction
The main risk here is that liquidity sweeps do not always resolve bullish, and a failure to hold this trendline on a retest would undercut the current setup quickly.
Broader market conditions, shifts in Bitcoin sentiment, and general altcoin risk appetite could all weigh on PI regardless of what this chart alone suggests.
This Pi Network technical analysis is based purely on current chart structure and available data, and conditions can change fast.
Glossary
CMP: Current Market Price, the price at which an asset is trading right now.Liquidity Sweep: A brief move through a key level that triggers stop losses and clears out weak positions before price reverses.FDV: Fully Diluted Valuation, the theoretical market cap if the entire max supply were in circulation.Ascending Trendline: A rising line connecting a series of higher lows, used to track the strength and direction of an uptrend.
Disclaimer
This article is for informational purposes only and should not be considered financial advice. Cryptocurrency markets are highly volatile, and readers should conduct their own research before making any investment decisions.