The price of Pi has changed 0% over the last 30 days, according to BSCN. Even so, the token traded from near $0.10 to close to $0.08 within that window. That contrast frames this Pi Network p
The price of Pi has changed 0% over the last 30 days, according to BSCN. Even so, the token traded from near $0.10 to close to $0.08 within that window.
That contrast frames this Pi Network price prediction October 2026, because a flat reading can hide a wide range.
Pi Network launched in 2019 as a mobile-first crypto project that lets users earn PI on their phones. The Pi coin now trades on major exchanges such as OKX under the ticker PI.
The Pi Network price today is $0.09154, up 3.3% in the last 24 hours, with a market cap of about $1.029 billion. That ranks it #78 among all cryptocurrencies.
And this Pi Network Price Prediction reviews market data, news, and the outlook for October.
Live PI Market Data
Metric
Value
Price
$0.09154
24H Change
+3.3%
24H Range
$0.08864 - $0.09232
Market Cap
$1.029B
Source: market data taken from CoinGecko, as of Sep 30, 2026. Figures may vary slightly across other tracking websites.
Circulating supply is 11.243B PI out of a total supply of 17.297B, so about 65% of the total is already in the market.
The gap between the $1.029B market cap and the $1.584B fully diluted valuation shows that more tokens are still to enter circulation.
Traders often watch this closely, because new supply can add selling pressure. The maximum supply is 100B PI, so the circulating amount is only about 11% of the long-term cap.
Trading volume of $6.639M is small next to a $1.029B market cap, so orders can move price quickly.
Perpetual futures open interest of $24.013M is about 3.6 times the 24-hour trading volume, which means leveraged positions carry a lot of weight.
Pi Coin News: BSCN Reports 0% Price Change in 30 Days
The latest Pi coin news comes from BSCN. Its post says the price of PI has stayed the same over the last 30 days.
A holder from August 29 would therefore show no gain or loss. The post adds that there were periods of notable fluctuation along the way.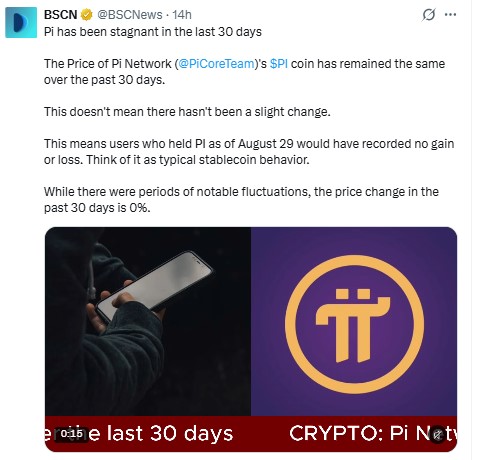
Source: Data taken from @BSCNews, X Account, as of Sep 30, 2026
The chart supports that second point. PI dropped toward the $0.08 area on September 17 and then recovered, so the flat 30-day number hides a wide range in between.
Anyone following Pi Network news should read the 0% figure as a comparison of two dates. It is not evidence of low volatility.
Pi Network Technical Analysis
This Pi Network technical analysis uses the 4-hour PIUSDT chart from OKX, viewed on Sep 30, 2026, at 10:30 IST (UTC+5:30).
In this timeframe, the Pi coin is moving inside an ascending triangle. A flat upper boundary sits near $0.0923, while a rising trendline runs up from the September 17 low. The two lines meet around October 7 on this chart.
Price has been turned away from the flat boundary twice, at Wolfe Wave points 2 and 4 on September 23 and September 26. 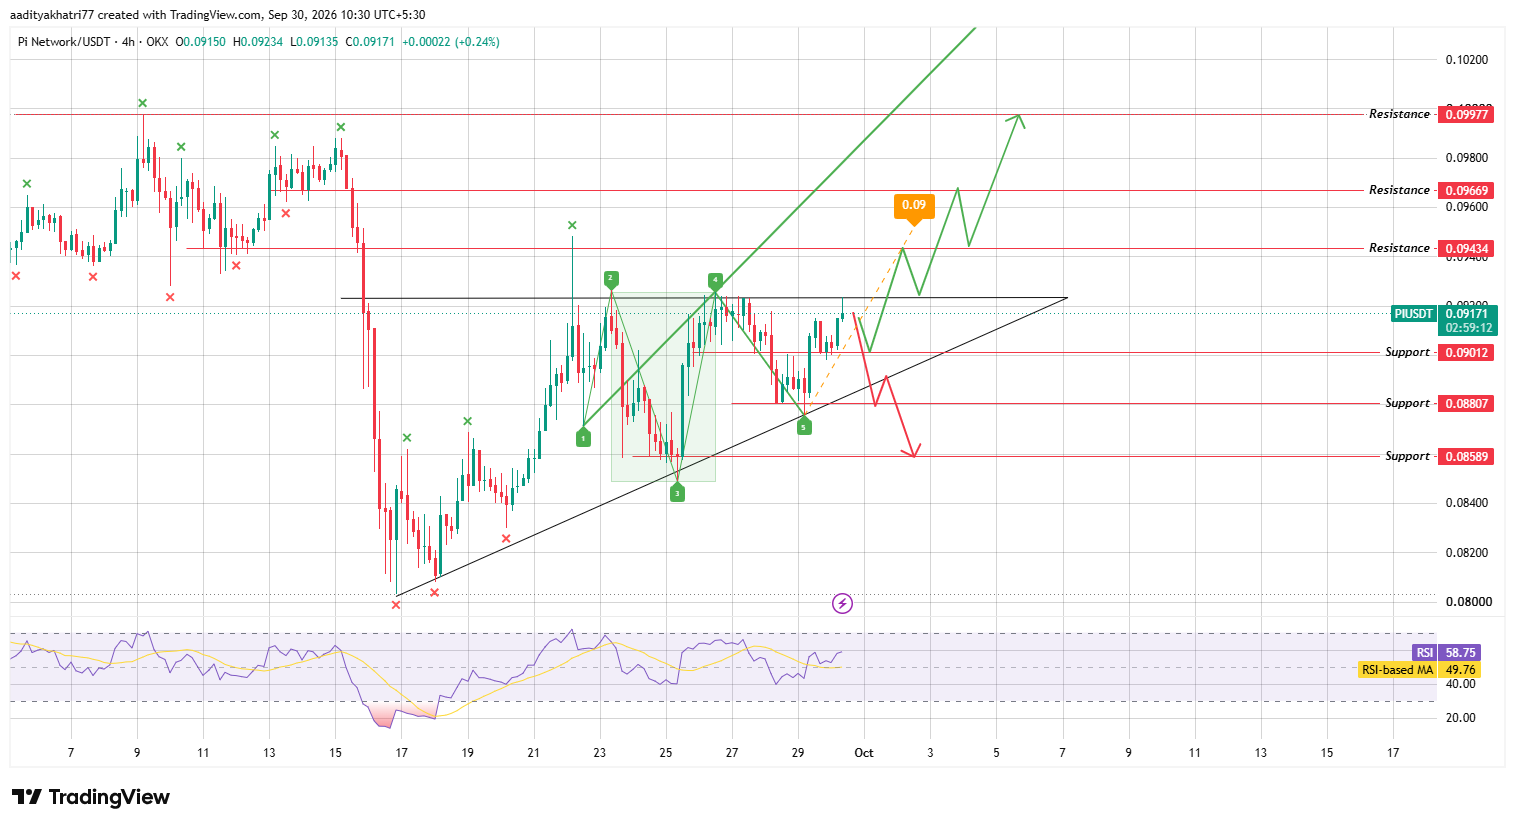
Source: Chart taken from TradingView, OKX PIUSDT 4-hour chart, as of Sep 30, 2026, 10:30 IST
The latest 4-hour candle trades at $0.09171, just below that boundary and above the $0.09012 support.
RSI reads 58.75 and sits above its moving average of 49.76. It is also above the 50 midline and below overbought territory, so momentum currently favors buyers.
The Wolfe Wave marked on the chart adds a bullish projection. The dip on September 29 formed point 5 near the rising trendline and the $0.08807 support.
From there, the projected line points toward roughly $0.0950, between the $0.09434 and $0.09669 resistance levels. That path only applies if the upper boundary breaks.
Can PI Break The Upper Boundary?
The bullish case starts with the $0.09012 support holding. If buyers defend it, the price can rise for a third test of the flat boundary near $0.0923.
A 4-hour candle close above that boundary would confirm a break of the triangle. Volume should also exceed the average of the previous 20 candles. The first resistance then sits at $0.09434, followed by $0.09669 and $0.09977.
The green path on the chart shows a retest of the broken boundary before the next move up. A retest is common after a breakout. A move without strong volume can fail and fall back inside the triangle.
What Happens If PI Breaks Support?
The bearish case begins with a failed hold at $0.09012. A 4-hour close below that level, followed by a break of the rising trendline, would end the triangle to the downside.
The first target is $0.08807, which matches the September 29 low. The next is $0.08589. The red path on the chart shows a weak bounce between those levels before a second leg lower.
Pi Network Price Levels to Watch
These Pi Network price levels come from the zones marked on the 4-hour chart.
Support
Resistance
$0.09012
$0.09434
$0.08807
$0.09669
$0.08589
$0.09977
Pi Network Price Prediction: Bull, Base, and Bear Scenarios
Scenario
Setup
Level
Bull
Upper boundary breaks on a 4-hour close with volume
$0.09434 to $0.09977
Base
Range trade between support and the flat boundary
$0.09012 to $0.0923
Bear
4-hour close below $0.09012, rising trendline breaks
$0.08807 to $0.08589
Pi Network vs Bitcoin
Bitcoin usually sets the direction for altcoins such as PI. A steady Bitcoin market gives a triangle breakout room to hold.
A sharp Bitcoin drop can push PI through support no matter what its own chart shows.
The market data shows PI up about 3.1% against Bitcoin over the past 24 hours. That means it is keeping pace with the market leader for now.
Methodology
This Pi Network price prediction 2026 update uses the 4-hour PIUSDT chart from OKX on TradingView.
The triangle boundaries, the Wolfe Wave points, the RSI, and the RSI-based moving average were read candle by candle. This Pi coin price prediction rests on a single 4-hour chart, so it reflects short-term conditions only.
Support and resistance levels come directly from the zones marked on that chart. Price, market cap, volume, open interest, and supply figures come from a CoinGecko snapshot. The 30-day price post comes from an X screenshot, dated Sep 30, 2026.
Nothing here replaces independent research. A chart pattern describes probability, not certainty, and a 4-hour setup can change within a few candles.
Expert Opinion
Taken together, the chart and the market data support a cautiously constructive Pi Network price forecast for October while PI stays above $0.09012. RSI is above its average, and the Wolfe Wave points higher.
Still, price has failed twice at the flat boundary, and thin trading volume leaves the token open to sharp reversals.
A confirmed 4-hour close above $0.0923 would favor buyers, while a close below $0.09012 would favor sellers. This is general market commentary, not a guarantee of direction.
Disclaimer: This article is for informational purposes only and does not constitute financial advice. Cryptocurrency markets, including Pi Network, carry high volatility and downside risk; prices can move sharply against any projected level, and past performance offers no guarantee of future results. Readers should conduct independent research before making any investment decision.