PI fell to a new all-time low of $0.05515 on Tuesday. The coin has dropped over 29% since early November. RSI sits near 25.25, which points to oversold conditions. PI Network extended its los
PI fell to a new all-time low of $0.05515 on Tuesday.
The coin has dropped over 29% since early November.
RSI sits near 25.25, which points to oversold conditions.
PI Network extended its losing streak on Tuesday and hit a new all-time low of $0.05515. At the time of writing, PI trades near $0.05900, down 4.7% in 24 hours.
Bears still control the chart. But the oversold reading leaves room for a short-term bounce.
PI hits a new low as market cap slips below $700 million
PI has been in a broader downtrend since mid-May. The drop got faster in November, with the price losing over 29% in a few weeks.
The market cap now sits near $672.29 million, and PI ranks #71 on CoinMarketCap. Only 11.39 billion of the 100 billion total supply is circulating.
The fully diluted valuation is about $5.9 billion. That gap between circulating and total supply is something traders keep an eye on.
Over the last 24 hours, PI traded between roughly $0.0576 and $0.0620 on the CoinMarketCap chart. The deeper wick to $0.05515 came earlier, during the Asian session.
Spot volume stands at $7 million, up 30.85%. That is a volume to market cap ratio of just 1.03%, so interest is still thin.
Derivatives data shows bears in control
Open Interest is at $24.8 million, up 11.16%. Derivatives volume is $31.17 million, up 7.37%.
The average funding rate is negative at -0.0089%. That points to a bearish tilt in funding sentiment.
Liquidations tell a clear story too. Of the $174.75K liquidated in 24 hours, $161.08K came from longs. Only $13.66K came from shorts.
Derivatives metric
Value
Change
Open Interest
$24.8 million
+11.16%
Trading volume
$31.17 million
+7.37%
Average funding rate
-0.0089%
Negative
24h liquidations
$174.75K
n/a
Long liquidations
$161.08K
n/a
Short liquidations
$13.66K
n/a
Pi Ecosystem Summit could add noise
The Pi Core Team announced a three-day Pi Ecosystem Summit from November 17 to 19, 2026.
Day one covers the developer platform, ecosystem plans and app showcases. Day two focuses on AI and the ecosystem. Day three kicks off a hackathon with a 200,000 USDT prize pool.
News like this can move price in either direction. So far, the chart shows no strong reaction.
PI Network price prediction: technical outlook
On the daily chart, price trades near $0.05900. That is below all four key EMAs, which shows steady selling pressure.
The chart keeps printing lower highs and lower lows. Sellers are still in charge here.
The 14-day RSI reads 25.25, with its signal line at 31.07. This is oversold territory, so a relief bounce cannot be ruled out. Still, oversold does not mean the fall is over.
If PI fails to reclaim the $0.065 to $0.070 zone, the price could slide back toward $0.055 and then $0.050.
Level
Price
Type
Support 1
$0.0551
All-time low
Support 2
$0.0500
Psychological level
Resistance 1
$0.0698
20-day EMA
Resistance 2
$0.0763
50-day EMA
Resistance 3
$0.0851
100-day EMA
Resistance 4
$0.1116
200-day EMA
On the upside, the first big hurdle is the $0.069 to $0.070 area, where the 20-day EMA sits. After that, bulls face $0.076 and $0.085.
A daily close above $0.076 would be an early sign of better momentum. A move above $0.085 could strengthen the case for a real reversal.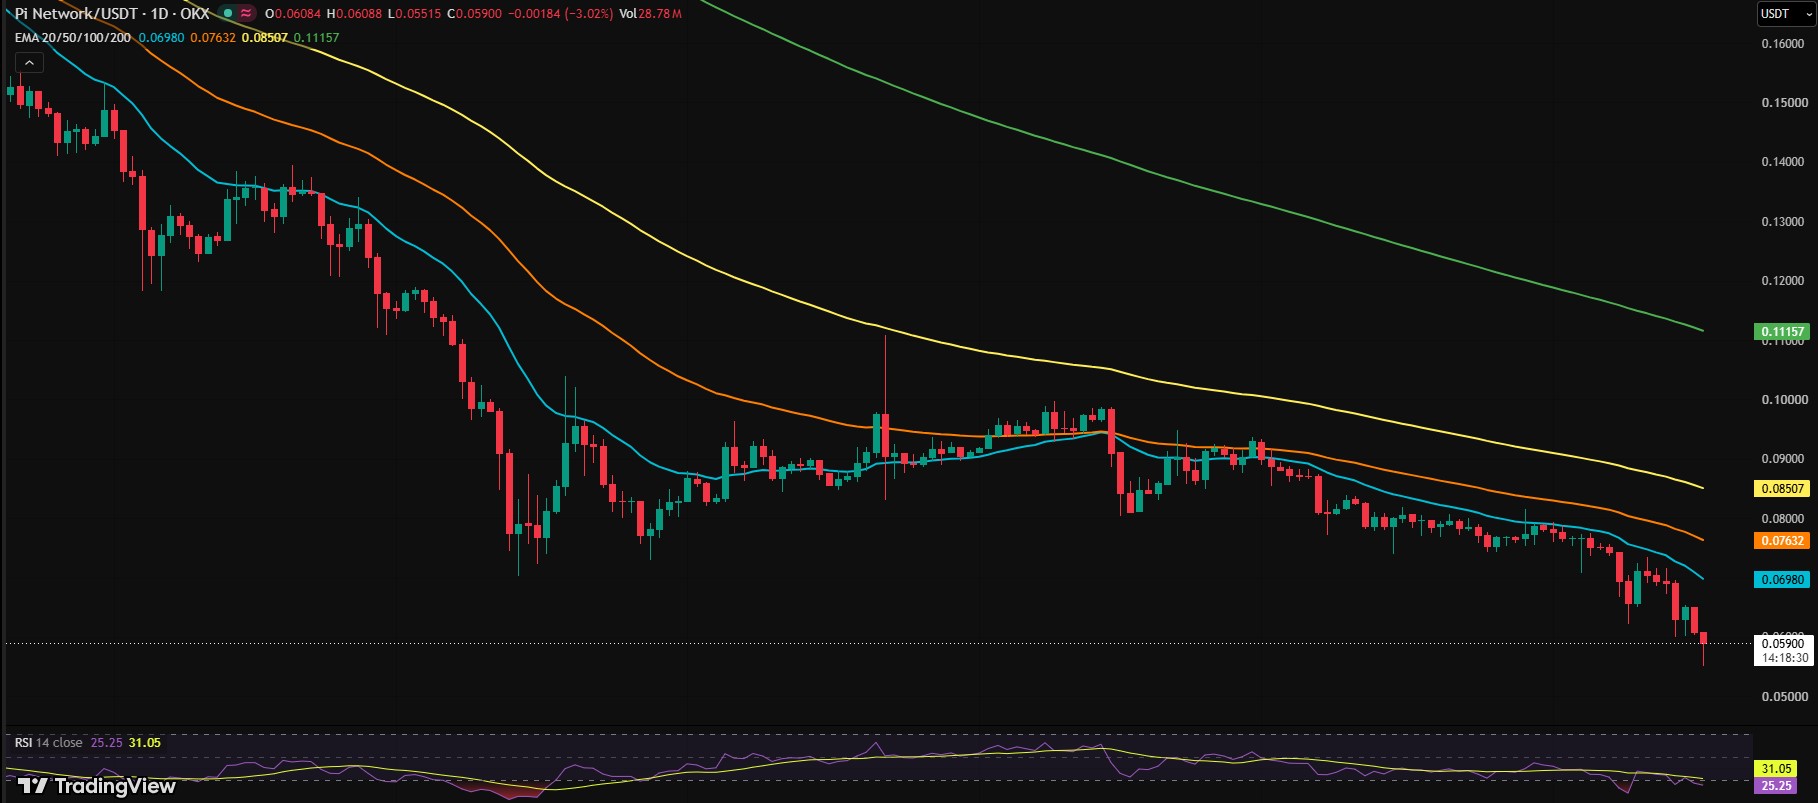
Until then, any bounce may meet heavy selling. Higher highs and higher lows would be the first signal that the mood is changing.
Disclaimer
This article is for information only and is not financial advice. Cryptocurrency prices are very volatile, and you can lose some or all of your money. Prices and data may change quickly. Do your own research and speak with a licensed financial advisor before you invest.