PI has been quietly losing ground, and buyers have gone silent. Anearlier bounce against Bitcoin showed how fragile these rebounds can be. Data here is current as of October 5, 2026, at 14:05
PI has been quietly losing ground, and buyers have gone silent. Anearlier bounce against Bitcoin showed how fragile these rebounds can be.
Data here is current as of October 5, 2026, at 14:05 UTC. Sellers hold the edge. For now.
Pi Network Price Prediction: Market Data Snapshot
Current Price and 24H Move
Spot trading shows $0.08668, a 1.27% dip over 24 hours. The range ran from $0.0862 to $0.0882.
And the latest 4-hour candle barely moved.
Sellers aren't panicking. They're grinding lower, one candle at a time.
Market Cap and Supply
Valuation sets the stage for any real move, so the numbers matter first.
PerCoinMarketCap data, market cap stands at $974.62M with 11.24B PI circulating out of 100B.
Fully diluted value sits at $8.66B, so roughly 89% of supply hasn't reached circulation.
Trading Volume and Open Interest
Spot volume reached $5.25M, up 73.06%.
The DefiLlama token overview shows $18.33M in volume and $13.92M in open interest, meaning outstanding derivative bets.
Trackers disagree on volume because venue coverage differs. But spot demand stays thin.
Exchange Liquidity
OKX leads PI/USDT trading with $2,212,170 in 24-hour volume, a 41.93% share. Gate and CoinW follow, whileexchange listing updates track new venues.
Quotes stay between $0.08651 and $0.08672. But Kraken shows only about $2,000 of depth within 2%.
Why Is $PI Moving Today?
The $PI price today is under pressure. Traders can scanAI crypto news for triggers.
Listings are quiet. Partnership headlines? None. Sellers keep pressing, and if the floor gives...
$0.08300 is the first stop. Volume jumped 73.06%. Price still slipped. Bad sign.
Pi Network Technical Analysis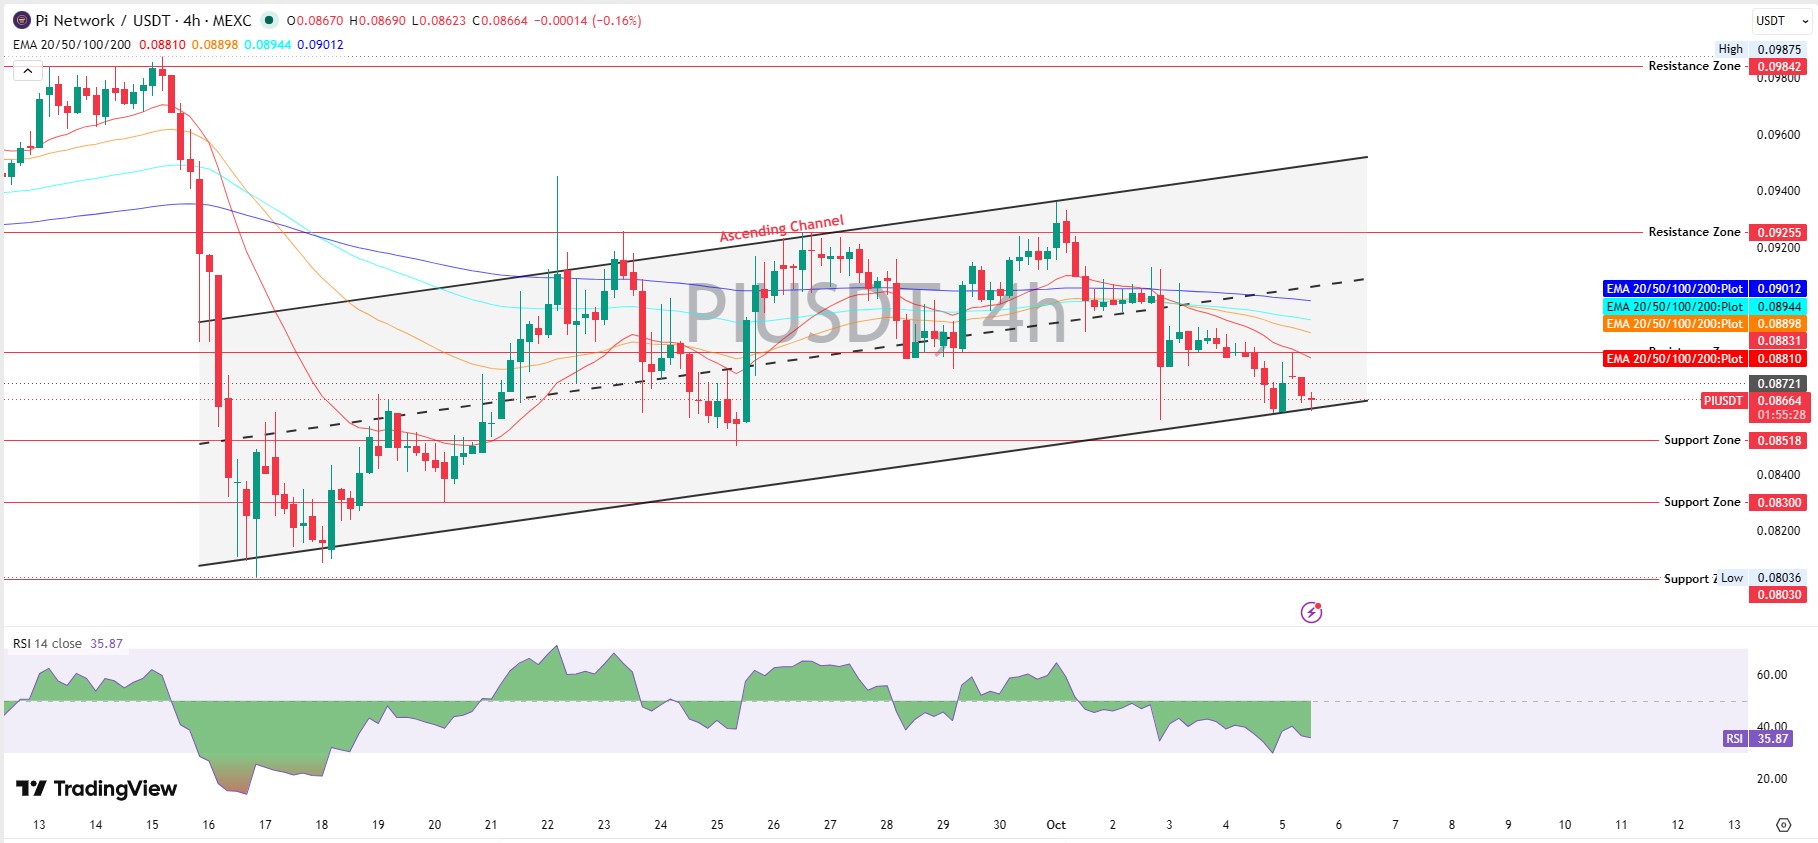
This Pi Network technical analysis uses theTradingView 4-hour chart for PI/USDT on MEXC, captured October 5, 2026, 14:05 UTC.
Trades hug the lower rail of an ascending channel. Bulls need it intact.
RSI and Momentum
$PI reads 35.87. Weak, not washed out. Oversold never guarantees a bounce.
EMA Levels
EMAs weight recent trades more heavily. The 20, 50, 100, and 200 EMAs sit at $0.08810, $0.08898, $0.08944, and $0.09012.
All four sit above current trading. Bearish stack, with each acting as a ceiling.
Channel Structure
Higher lows since mid-September built the ascending channel. Readers tracking structure can revisitOctober channel levels.
Losing the lower rail and pulling back becomes a breakdown. The chart doesn't lie.
Key Levels to Watch
Support Zones
$PI support and resistance starts with the floor. Support sits at $0.08518, then $0.08300, then $0.08030.
That last zone matches the $0.08036 low. Lose it, and $0.07072, the all-time low, enters the conversation.
Resistance Zones
Resistance stacks at $0.08831, $0.09255, and $0.09842, and anearlier $0.09298 test already put that region in focus.
Can $PI break $0.09255? That's the real test.
Breakout Confirmation
A breakout needs one thing, and it's simple. Trades holding above $0.08831, then above the 200 EMA at $0.09012. And volume must rise with it.
Breakdown Risk
A breakdown below $0.08518 puts $0.08300 in play. Context on flat stretches sits in thisbigger move analysis.
Bears don't need much. A slide to $0.08300 is roughly 4% away.
Can $PI Rally Continue?
Bullish Scenario
Bulls could target $0.09255 if trades reclaim $0.08831 with rising volume. Comparable setups appear acrossother coin forecasts.
That path demands patience. And it needs RSI back above 50.
Base Scenario
Sideways trading between $0.08518 and $0.09012 seems the most probable path.
Chop, not crash.
Bearish Scenario
Bears own the tape, with trades under all four EMAs. A bullish Pi Network price prediction feels premature.
Bearish, then. Or maybe not yet, since the channel floor still holds.
So why would buyers step in here?
Volume rose 73.06%, yet trades still slid.
Pi Network Price Prediction for October 2026
This Pi Network price prediction relies on scenarios, not certainty.
Bull Case
Under the $PI price prediction for the October 2026 bull case, a $PI price target of $0.09255 to $0.09842 is possible.
A hold above $0.09012 would be needed. Invalidation: a trade below $0.08518.
Base Case
Base case, per this $PI price forecast: $0.08518 to $0.09012, with flat volume and trades respecting the channel.
Invalidation arrives on a decisive break outside that band.
Bear Case
Bear case: $0.08030 to $0.08300, if the channel floor breaks.
Invalidation: a reclaim of $0.08831 on strong volume.
Will $PI Reach $0.10?
$PI needs roughly 15% upside and a break above the $0.09875 high.
Possible, sure. Likely near term? Not with this structure.
Launchpad Testnet Tokens
ThePi testnet token explorer lists SLICE and IRRA, both carrying TESTNET tags, near 2.58 Test-Pi each.
Test-Pi carries no market value. So those figures are rehearsal data, not demand. But the launchpad does signal ecosystem activity.
What Could Shift the Forecast
Mainnet launches, fresh listings, or a volume surge could flip sentiment. Launch schedules appear on thepresale and IDO calendar.
Until then, the $PI short-term price prediction stays negative below $0.08831.
Long-Term Price Prediction for PI
Supply drives the PI long-term price prediction, with only 11.24B of 100B tokens circulating. Acoin events calendar tracks catalysts.
All-time high sits at $2.98, set in February 2025. Current trades are 97.09% below it.
$PI has gained 22.5% from its $0.07072 low in July 2026. Any Pi Network price prediction past October needs patience.
Risks That Could Change the Forecast
Distribution events add selling risk, and acrypto airdrops tracker helps follow them.
Thin depth, an 88.76% uncirculated supply, and fading volume all weigh on any recovery.
Bulls have work to do.
Final Takeaway
This Pi Network price prediction leans bearish while trades stay below $0.08810.
Broadermemecoin market news may add direction, but chart structure leads.
Bulls need a reclaim of $0.09012, because until then the tone stays heavy.
Disclaimer: This article is for informational and educational purposes only and isn't financial, investment, or trading advice. Crypto assets are volatile, and prices can move sharply in either direction. Price scenarios are conditional, not guaranteed. Independent research and professional guidance are recommended before any trading decision. Market data was captured on October 5, 2026, at 14:05 UTC and can change quickly.