Is Polkadot setting up for a real bounce, or just catching its breath before another slide? Traders have argued about that all week, and the numbers from October 23, 2026, 11:29 UTC say more
Is Polkadot setting up for a real bounce, or just catching its breath before another slide? Traders have argued about that all week, and the numbers from October 23, 2026, 11:29 UTC say more than most opinions do.
This Polkadot price prediction walks through the $DOT price chart, ETF flows, and liquidations in simple words, much like any crypto price prediction built on real data. Short version first. Bulls hold a thin edge, and it vanishes fast below $1.099.
Polkadot Market Snapshot: DOT Price Today
The $DOT price sits at $1.17 onCoinGecko market data, down 0.3% over 7 days, and is ranked 53 by size as of 11:29 UTC. Quiet on the surface. But a 24-hour range of $1.10 to $1.20 tells a busier story.
Metric
Value
Price
$1.17
7-day change
-0.3%
24-hour range
$1.10 to $1.20
Market cap
$1.998B
24-hour trading volume
$165.389M
Perpetual futures open interest
$1.404B
Source: Data Taken from CoinGecko
21Shares Polkadot ETF Holdings News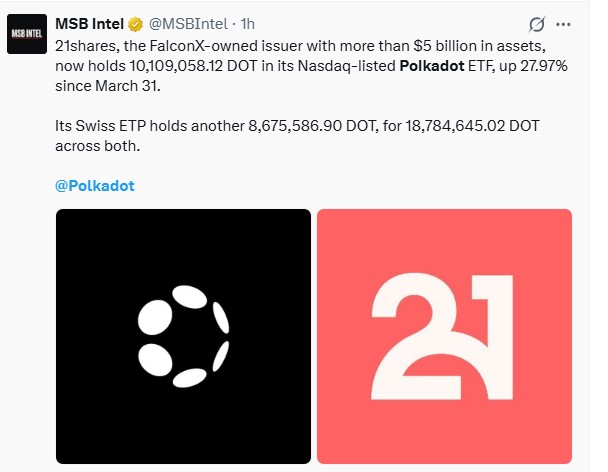
Source: News from MSBIntel
Fresh news from MSB Intel on X. 21Shares now holds 10,109,058.12 DOT in its Nasdaq ETF, up 27.97% since March 31, while its Swiss ETP adds another 8,675,586.90 DOT.
Total holdings reach 18,784,645.02 DOT, or about 1.1% of circulating supply. The issuer, owned by FalconX, manages more than $5 billion in assets, and newcomers can read thisPolkadot ecosystem guide to see what DOT powers.
But months of steady buying don't guarantee strong daily inflows, and the next section shows how quiet the latest session was. Patience, then.
Polkadot ETF Data: Net Inflow and Net Assets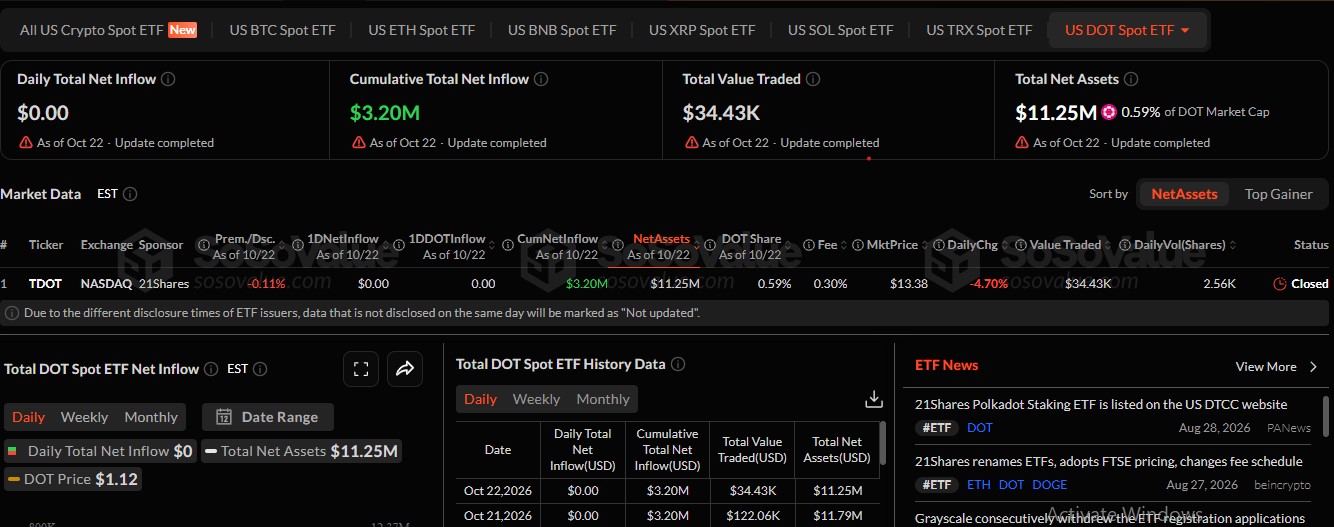
The Polkadot ETF had a quiet day on October 22, 2026. TDOT, the 21Shares fund on Nasdaq, saw $0.00 in new money come in, based onSoSoValue ETF tracker data. The fund has taken in $3.20M in total so far, but its assets fell to $11.25M from $11.79M a day earlier.
That's just 0.59% of $DOT's market cap. Tiny. Trading in the fund also dropped to $34.43K from $122.06K, and its shares sold at a -0.11% discount, which simply means they cost a little less than the DOT they hold.
It's not a collapse, just a pause in buying, but a 0.30% fee and low trading volume don't exactly attract big money, so flows can stay slow for a while until more investors start paying attention to the fund.
DOT Liquidation Data: Shorts Take the Bigger Hit 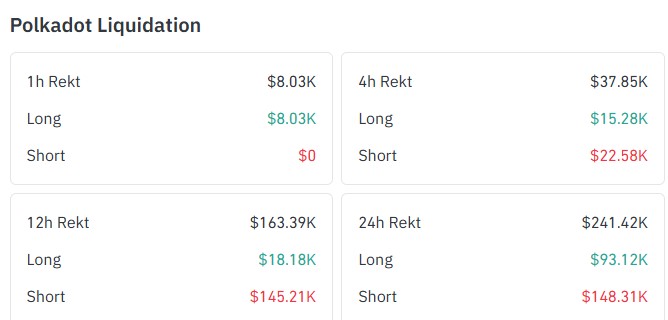
$DOT liquidation data fromCoinglass liquidation data shows $241.42K wiped out in 24 hours, which happens when an exchange forcibly ends a borrowed-money trade after losses drain its margin. Shorts took the bigger hit at $148.31K, against $93.12K for longs.
Shorts got hit hardest. Mostly in the 12-hour view, where $145.21K in shorts vanished against only $18.18K in longs. But the last hour flipped, with $8.03K in longs and $0 in shorts, a sign the push is fading.
So who's still buying after that squeeze? Volume across exchanges hints at where that money sits, and the next section maps it out.
DOT Volume Heatmap by Exchange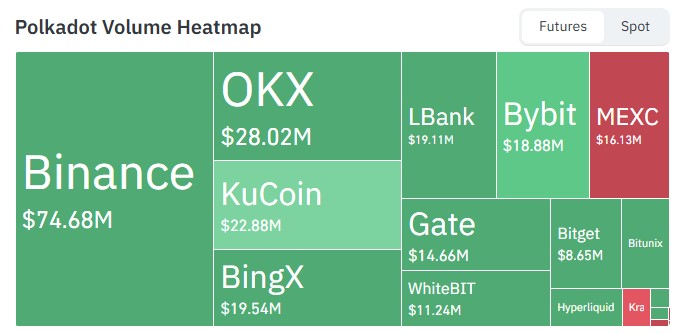
Binance leads the Polkadot volume heatmap with $74.68M, followed by OKX at $28.02M and KuCoin at 22.88M.BingX(19.54M, with LBank (18.88M) trailing behind, while MEXC shows red at $16.13M, a hint of selling pressure.
Binance alone holds nearly a third of the volume among the ten biggest boxes shown, and thesealtcoin market updates add wider context.
DOT Price Prediction: 4-Hour Chart Analysis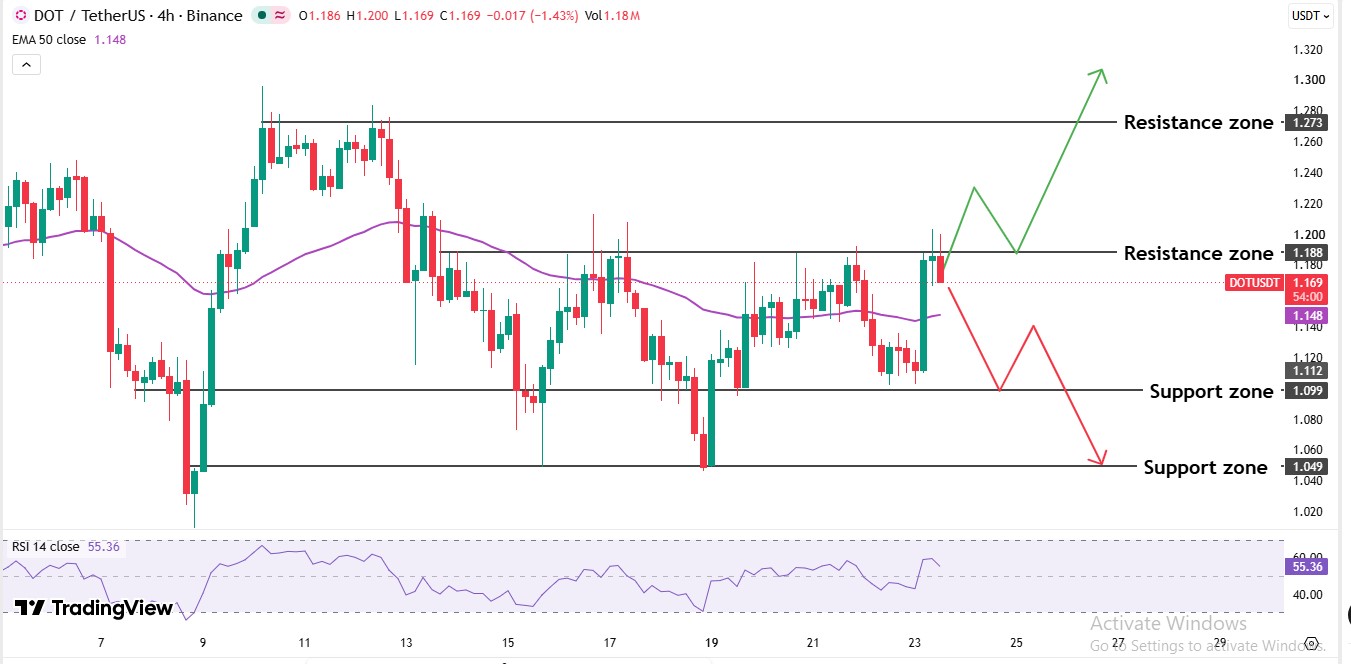
Price trades near $1.169. Right under a ceiling that has turned buyers away before, as thisearlier resistance analysis explains.
The 50-period EMA sits at $1.148, and DOT trades above it, so the short-term trend stays mildly positive. RSI reads 55.36. Neutral, with a slight bullish lean.
And the latest candle is red after tagging $1.20, and momentum isn't screaming either way, which is why the reaction at $1.188 will decide the next move.
DOT Support and Resistance Levels to Watch
For any Polkadot price prediction, levels matter more than opinions, and the DOT support and resistance zones below come straight from the 4-hour chart, so each one reflects real trading activity.
Level
Type
What it means
$1.273
Resistance
Upper ceiling and the main bullish target
$1.188
Resistance
Nearest ceiling that sellers keep defending
$1.099
Support
Level that caught the latest dip
$1.049
Support
Mid-October floor that held
The $1.188 zone matters most, since sellers have turned price away from it repeatedly this month.
Polkadot Price Forecast: Bull, Base, and Bear Scenarios
Rising ETF inflows, stronger volume, and more squeezed shorts would fuel that move, since a breakout on thin trading tends to fade fast, and a pastDOT breakout analysis shows how such breakouts usually unfold.
Bull case: a push through $1.188 would flip that ceiling into support and open the way toward $1.273, about 8.9% above $1.169.
Base case: price keeps swinging between $1.099 and $1.188 over the next few sessions, with the 50-period EMA at $1.148 acting as the midpoint.
Bear case: rejection at $1.188 sends price back toward $1.099, and a slip beneath that exposes $1.049, roughly 10.3% below $1.169. Flat ETF flows and fresh long liquidations give this path real weight.
Scenario
Trigger
Target zone
Bull
Trades above $1.188
$1.273
Base
Holds between $1.099 and $1.188
$1.099 to $1.188
Bear
Rejection at $1.188, then a slip below $1.099
$1.049
Polkadot Price Prediction: Expert Outlook
As perCoinGabber analysis, the Polkadot price prediction points to a sideways move with a small lean to the upside. A rally seemed easy to call at first. But on second thought, flat ETF flows and a fading push make patience the better call.
Verdict: $DOT turns mildly bullish only above $1.188 and stays cautious below $1.099. And $1.273 needs fresh buying before it comes into play. Timing matters here.
Disclaimer: This article is for information only and isn't financial advice. Crypto prices swing fast, so anyone trading should do independent research and manage risk carefully.