Polkadot price prediction searches are heating up after Polkadot finally did something it had failed to do four times in a row. Traders who watched this coin get turned back at the same falli
Polkadot price prediction searches are heating up after Polkadot finally did something it had failed to do four times in a row. Traders who watched this coin get turned back at the same falling line again and again are now watching a very different chart.
The setup below breaks down exactly what changed and which levels matter from here.
The levels described here apply strictly to the 4-hour timeframe covered and should be rechecked if the price closes beyond the stated range.
Polkadot Price Right Now
Metric
Value
Price
$0.8383
24h Change
+6.31% (+$0.0498)
Market Cap
$1.42B
Futures Volume (24h)
$162.63M
Spot Volume (24h)
$17.38M
Open Interest
$153.65M
Circulating Supply
1.69B DOT
Total Supply
1.69B DOT
Max Supply
2.10B DOT
Open interest refers to the total value of DOT derivative contracts still open across exchanges, a rough gauge of active leveraged positioning.
Chart source: DOT/USDT 4-hour perpetual contract, TradingView, Binance data feed, captured August 4, 09:38 AM IST.
Market cap, volume, and supply figures from DOT market data on CoinGlass were captured the same day.
Methodology and Data Sources
This Polkadot price prediction uses the DOT 4-hour chart on Binance via TradingView for price structure, with volume, open interest, and market cap figures from CoinGlass, and liquidation flow from CoinGlass's DOT liquidation tracker.
Readers who want the wider monthly picture beyond this single setup can also check Polkadot price target levels.
All levels are treated as invalidated only on a confirmed candle close beyond the stated trigger, not an intraday wick.
Since this setup is built purely off the 4-hour timeframe, it is worth rechecking once the price closes clearly above or below the range described below.
Liquidation Data Today
Liquidation activity across every window leans heavily toward shorts, the opposite of what a slide lower would normally produce.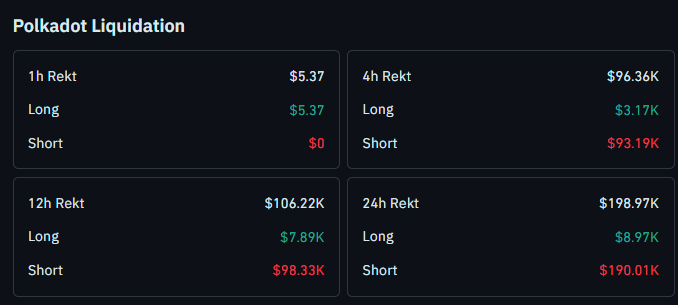
Over the past hour, only $5.37 was liquidated, all of it from long positions, with nothing wiped from shorts.
The 4-hour window shows $96.36K in total liquidations, of which $93.19K came from shorts and just $3.17K from longs.
The 12-hour window shows $106.22K total, with $98.33K from shorts against $7.89K from longs. Across the full 24 hours, liquidations hit $198.97K, and shorts account for $190.01K of that figure, while longs make up just $8.97K.
This short-side liquidation lines up with the trendline break.
Source: DOT liquidation data, CoinGlass, checked August 4, around 09:38 AM IST.
Key Takeaways
DOT broke above a descending trendline that had rejected it four separate times
The fifth test flipped into a confirmed close above the line, not just a wick
A pullback to retest $0.7950 followed by renewed buying keeps the setup intact
Shorts have taken the bulk of liquidations across the 1h, 4h, and 24h windows
A close below $0.7950 would undo the structure and shift focus back to $0.7429.
Polkadot Price Prediction: 4-Hour Chart Analysis
On the 4-hour chart, DOTUSDT.P spent weeks sliding along a descending trendline, with every bounce fading before it could challenge the line.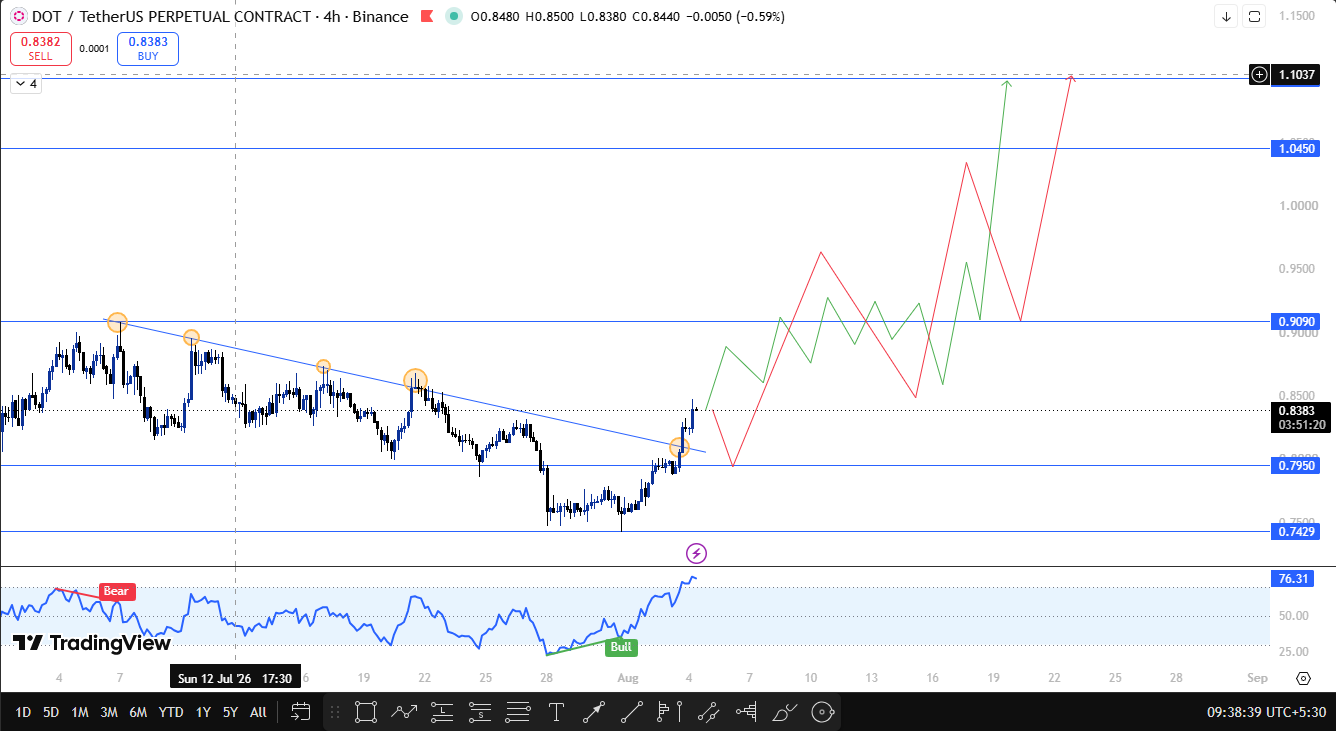
Four separate touches ended the same way, sellers stepping back in almost immediately and pushing the price to a fresh lower low each time.
That pattern held firm for so long that a fifth failed attempt looked like the obvious outcome.
Instead, the fifth touch broke straight through. DOT did not just wick above the line, it closed above it and has continued pushing higher since, a shift also worth weighing against whether Polkadot smashing through ten dollarsis realistic over a much longer horizon.
A close above a trendline that rejected price four times is generally read as a stronger signal than a brief poke above it, since it shows sellers actually lost control rather than just pausing.
If it pulls back to retest that broken trendline near $0.7950 and buyers step back in, the path toward $0.9090 and then $1.0450 stays open, with $1.1004 in play as an extended target if Bitcoin cooperates.
Technical Outlook Snapshot
Indicator
Signal
Trend
Broke above a descending trendline on the fifth test
Structure
Confirmed close above the line, price holding higher since
Liquidations
Shorts dominated the 4h, 12h, and 24h windows
BTC Correlation
Broader market tone likely matters for the extended target.
Support and Resistance Levels to Watch
Type
Level
Note
Extended Target
$1.1004
Only in play if Bitcoin supports the wider move
Resistance 2
$1.0450
Second target on continuation
Resistance 1
$0.9090
First target if the $0.7950 retest holds
Current Price
$0.8383
Trading above the broken trendline
Support 1
$0.7950
Retest zone, needs to hold on a closing basis
Support 2
$0.7429
Next support if $0.7950 breaks and closes below
Risk-Reward Table
Case
Trigger
Target
Bull Case
Holds above $0.7950 on a retest
Move toward $0.9090, then $1.0450.
Bear Case
Closes below $0.7950
Slide toward $0.7429.
Invalidation Level
This Polkadot price prediction stays constructive as long as DOT holds above $0.7950 on a closing basis.
A confirmed close below that level would undo the breakout and put $0.7429 back in focus.
If DOT instead holds the retest, $0.9090 and then $1.0450 remain the levels to watch, with $1.1004 as the stretch target.
How Bitcoin Could Influence Polkadot
This setup is based on 4-hour chart, but Bitcoin still tends to set the tone for how far a move like this can extend.
If Bitcoin holds firm or trends higher, it generally improves the odds of DOT working through $0.9090 and $1.0450 toward the $1.1004 extended target.
A weaker Bitcoin tape raises the risk that DOT stalls below resistance even if the trendline break holds.
Many traders also watch Bitcoin dominance as a rough gauge of whether capital favors majors or altcoins, though this analysis does not track dominance figures directly and treats it only as general market context.
Planned Update
This Polkadot price forecast will be revisited if DOT confirms a close above $0.9090 or below $0.7950, or if fresh liquidation or volume data meaningfully changes the setup described here.
Glossary
Descending Trendline: A downward-sloping line connecting successive lower highs, used to track resistance during a downtrend.
Open Interest: The total value of derivative contracts, like futures, that remain open and have not yet been settled or closed.
Liquidation: What happens when a leveraged trade gets forcibly closed because the trader ran out of margin to keep it open.
Retest: When a price returns to a previously broken support or resistance level, test whether it now acts as the opposite.
CoinGabbar's Technical Analyst View
The fifth trendline test is the key thing to watch on this DOT chart, since the first four attempts all failed and led to fresh lower highs.
Whether it holds above $0.7950 on the retest or slips below it will likely determine the next move.
A hold above $0.7950 opens the door toward $0.9090 and $1.0450, with $1.1004 possible if Bitcoin cooperates, a broader question tied to whether Can Polkadot recover strongly over the coming months.
Disclaimer
This Polkadot price prediction is based on technical chart analysis and market data available at the time of writing. Cryptocurrency markets are highly volatile, and prices can change rapidly. This content is for informational purposes only and should not be considered financial advice. CoinGabbar and the analyst do not hold a position . Always do your own research and consult a qualified financial advisor before making any investment decisions.