Who paid for Polkadot's latest dip? Leveraged longs did. In the last 24 hours, about 93% of $DOT liquidations hit traders betting on a rise, and price is still sitting above a key floor. In t
Who paid for Polkadot's latest dip? Leveraged longs did. In the last 24 hours, about 93% of $DOT liquidations hit traders betting on a rise, and price is still sitting above a key floor.
In this Polkadot Price Prediction, $DOT trades at $0.9375, down 1.45% on the day, between support at $0.9062 and resistance at $1.0120. A late-October dip under $0.9062 did not hold. Whether that floor survives another test is now the question.
Market data checked on November 2, 2026, at 23:47 IST.
Polkadot Price Prediction Today: Market Overview
Metric
Value
Price (TradingView daily chart)
$0.9375
Daily Candle Change
−1.45% (−$0.0138)
Candle Open
$0.9513
Candle Range
$0.9291 – $0.9650
24h Liquidations
$139.58K (about 93% long)
Polkadot News Today: Longs Take 93% of Liquidations
A derivatives dashboard shows $139.58K in DOT liquidations over 24 hours. Longs made up $129.87K and shorts $9.71K. Over 12 hours, the total was $95.91K, with $94.10K from longs and only $1.81K from shorts.
A liquidation happens when an exchange force-closes a leveraged position because the trader's margin has run out. Longs get liquidated when price falls, so this split fits DOT's slide from its October highs.
Source: Data From CoinGlass
The amounts are small in dollar terms. A flush of longs can clear weak positioning, but it does not prove a bottom.
Polkadot Price Prediction: How the DOT Chart Reads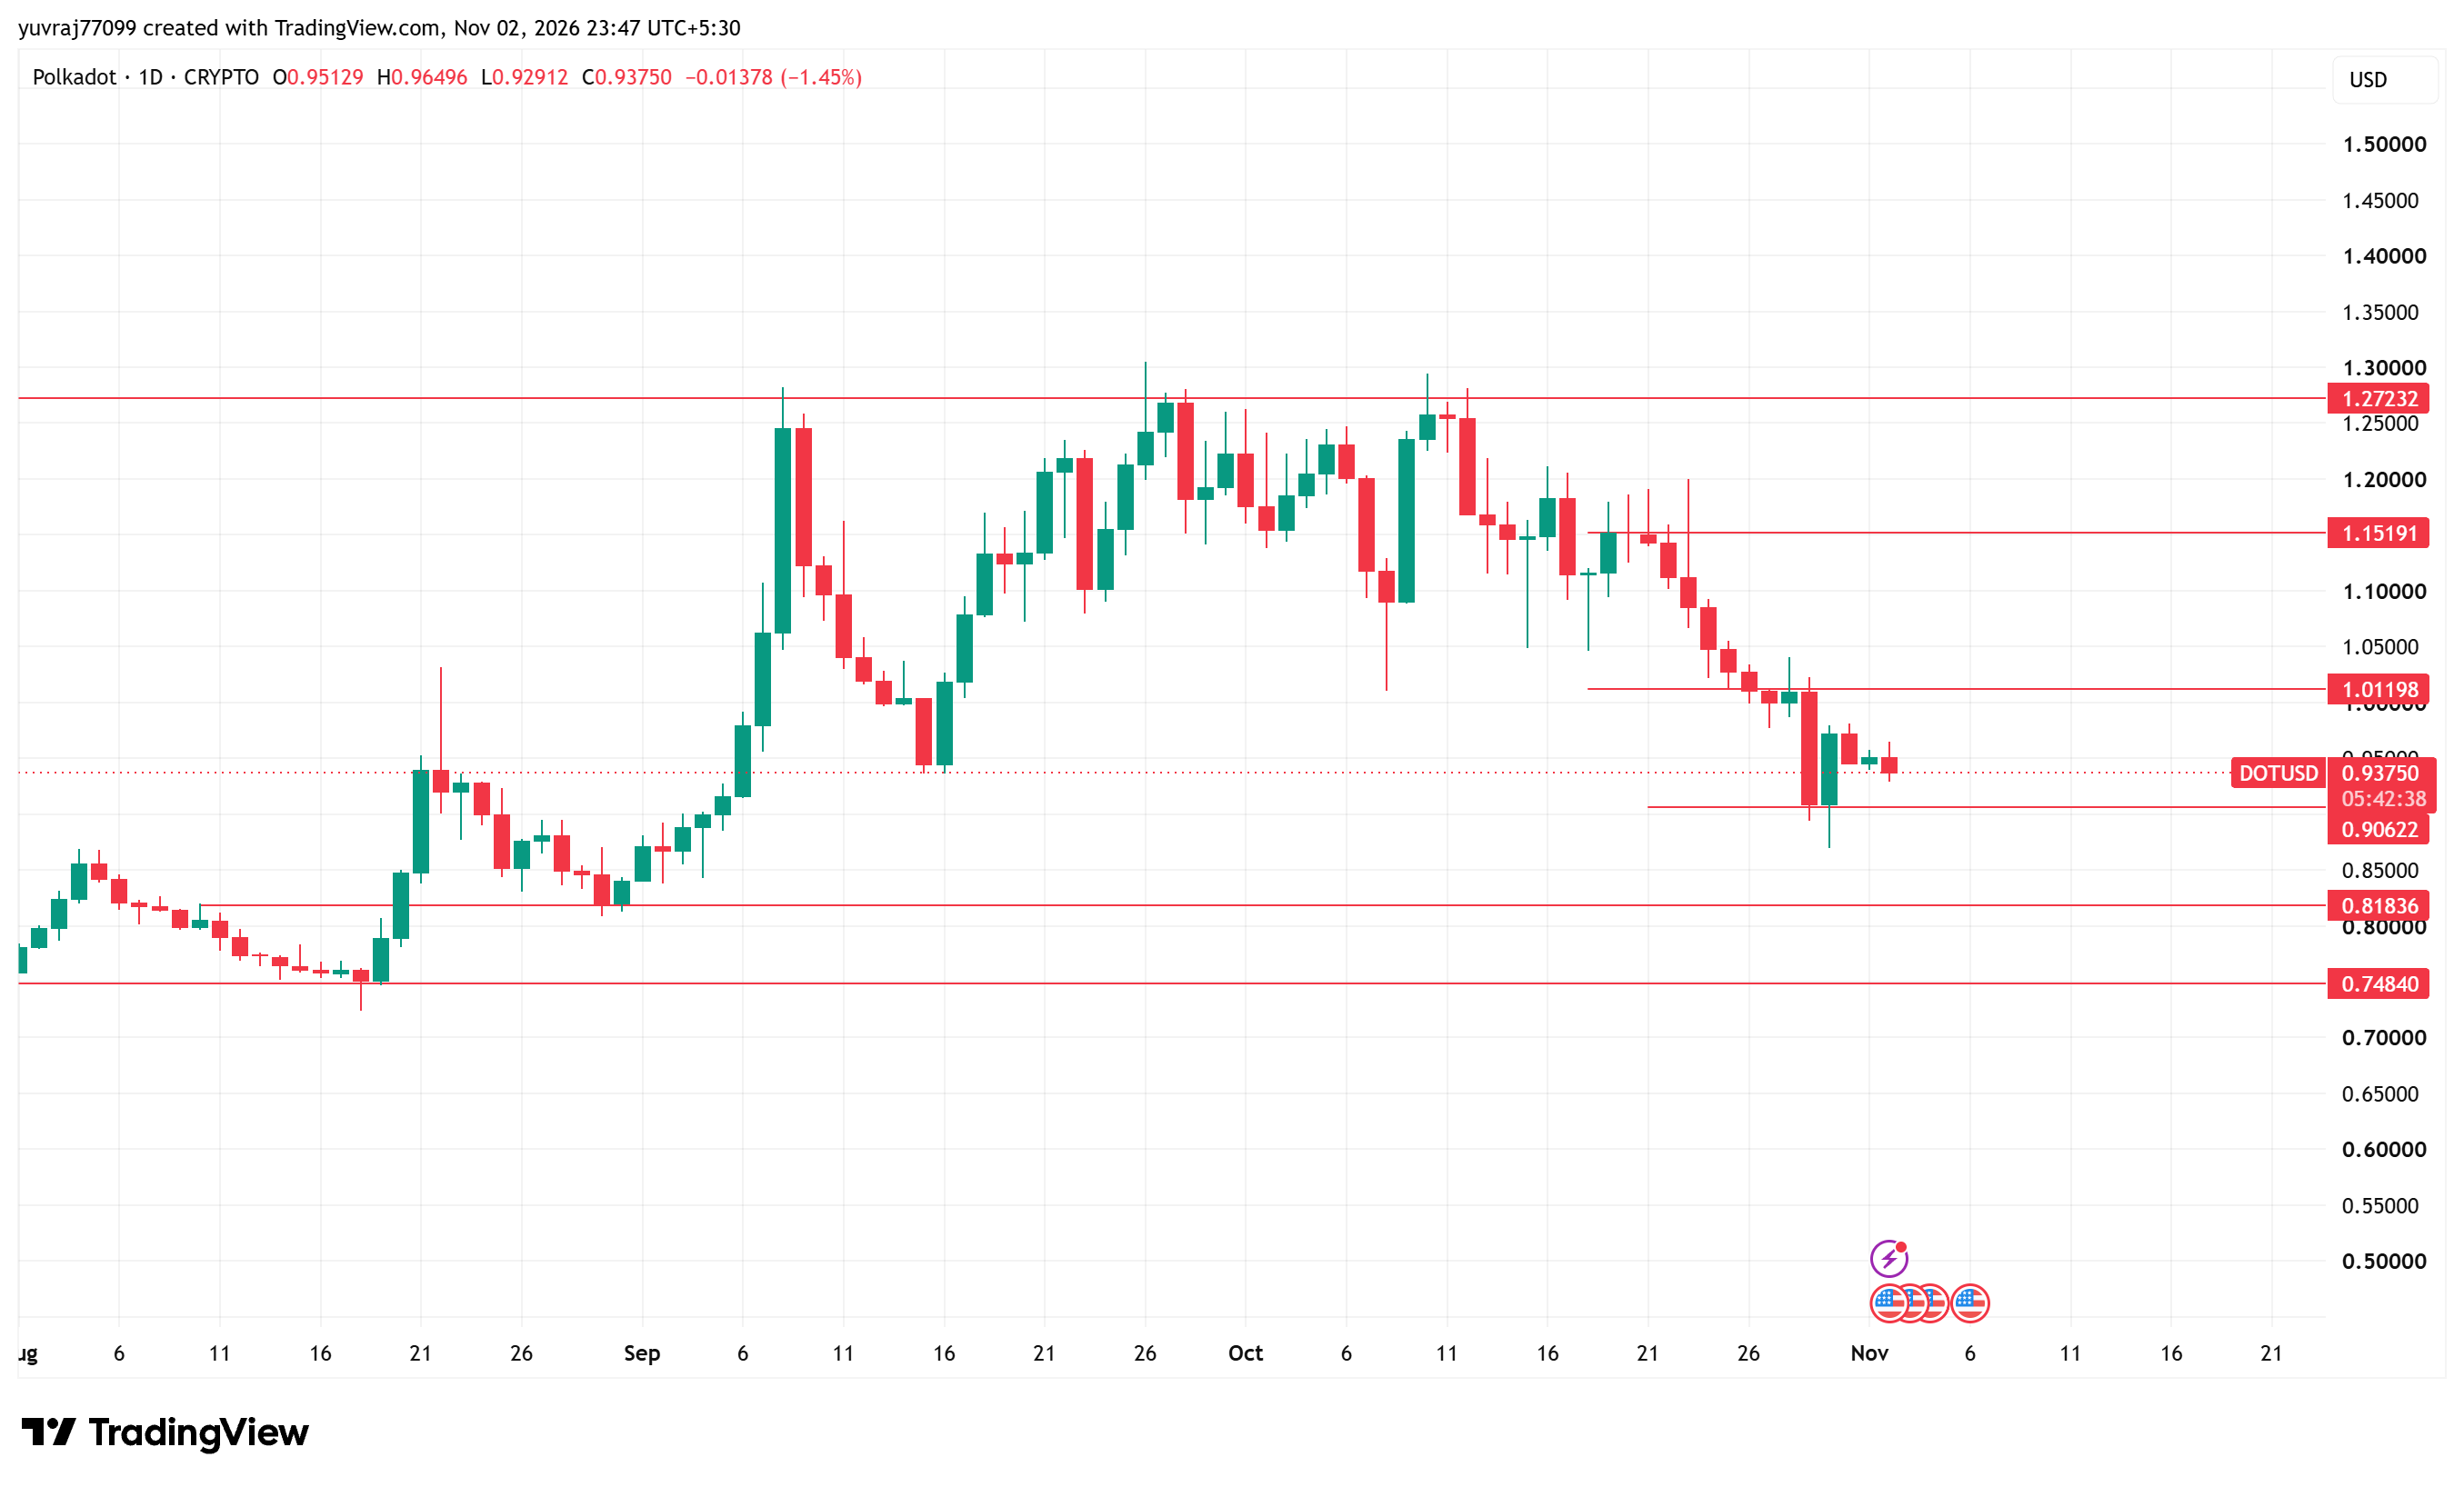
DOT rose from about $0.72 in mid-August to near $1.28 in early September. It pulled back to about $0.94, then climbed to roughly $1.30 in late September and tested that zone again around October 11.
That makes $1.2723 a level that has capped three rallies. Since then, price has made lower highs and now sits roughly 27% below the October peak.
The late-October sell-off came as a long red candle that closed near $0.9062, the line now marked as support. The next day, a green candle dipped to about $0.87, by eye, then closed well above the line.
A move below support that reverses quickly is called a failed breakdown. It shows buyers stepped in, though it does not confirm a trend change, and price has since drifted back toward the line.
Today's candle opened at $0.9513, ranged from $0.9291 to $0.9650 and printed $0.9375. It was still open, so the close can change.
Polkadot Forecast: Support and Resistance Levels
Type
Level
Highest marked level
$1.2723
Resistance 2
$1.1519
Resistance 1
$1.0120
Immediate support
$0.9062
Deeper support
$0.8184
Lowest marked level
$0.7484
Bull case: A daily close above $1.0120, about 8% higher, would put $1.1519 in view, about 23% above today's price.
Bear case: If DOT closes below $0.9062, about 3% lower, price could slide about 13% toward $0.8184. The $0.7484 level sits about 20% below today's price.
DOT Scenarios and Invalidation (November 2, 2026)
Scenario
Trigger
Likely Outcome
Invalidation
Bull
Close above $1.0120
Move toward $1.1519
Close back below $0.9062
Base
Range of $0.9062 to $1.0120
Sideways inside the band
Break of either level
Bear
Close below $0.9062
Slide toward $0.8184
Close back above $0.9062
Can Polkadot Reach $1.2723?
It would take a gain of about 36% from $0.9375. $DOT must clear $1.0120 and $1.1519 first, and it has stalled at $1.2723 three times. A shift in leveraged positioning alone is unlikely to cover that distance.
Polkadot Price Prediction: CoinGabbar Technical
$DOT is in a pullback after failing at $1.2723. The failed dip and the flush of longs are small positives, but price has not closed above $1.0120 and the pattern of lower highs is intact.
The level to watch is $0.9062. A daily close below it would open $0.8184, while a close above $1.0120 would be the first real sign of strength.
Disclaimer
This article is for informational purposes only and isn't financial advice. Crypto markets are volatile. Always do your own research before making any trading decisions involving DOT.