Polkadot's chart has already delivered two sharp rallies this cycle, one of about 36% and another of roughly 50%. Now a third move of similar size is lining up on the chart. $DOT is up over 2
Polkadot's chart has already delivered two sharp rallies this cycle, one of about 36% and another of roughly 50%. Now a third move of similar size is lining up on the chart.
$DOT is up over 2% today, trading just above $1.01, with BSCN also spotlighting Polkadot's treasury funding model and its focus on community-driven development.
This Polkadot price prediction checks that setup against DOT's actual support and resistance levels.
Market data was checked on September 14, 2026, based on the chart timestamped 10:44 (UTC).
Polkadot Price Prediction Today: Market Overview
Metric
Value
Price
$1.0199
Market Cap
$1.73B (+1.33%)
Unlocked Market Cap
$1.78B
24h Volume
$94.15M (+1.08%)
Vol/Mkt Cap (24h)
5.42%
FDV
$2.14B
Total Supply
1.7B
Max Supply
2.1B
Circulating Supply
1.7B
Source: Data from CoinMarketCap as of September 14, 2026, at 10:21 IST. Figures may vary slightly across other tracking websites.
Crypto News Today: Polkadot's News Treasury Funding Model
BSCN highlighted Polkadot's treasury funding model as a key part of building a robust blockchain ecosystem, describing how the treasury supports community-driven development and what that means for DOT going forward.
Source: Data From X
$DOT Price Technical Analysis
Pair: DOT/USD · Market: Spot · Timeframe: 1D · Timestamp: September 14, 2026, 01:44 UTC-3
$DOT trades at $1.0199, up 2.08% on the candle.
The chart marks two prior measured moves this cycle, one of about 36% in mid-August and another of roughly 50% in early September, and now flags a projected move of similar size, around 46%, that would target the $1.50 area if it plays out.
RSI (14, Relative Strength Index) reads 56.40, moderately bullish.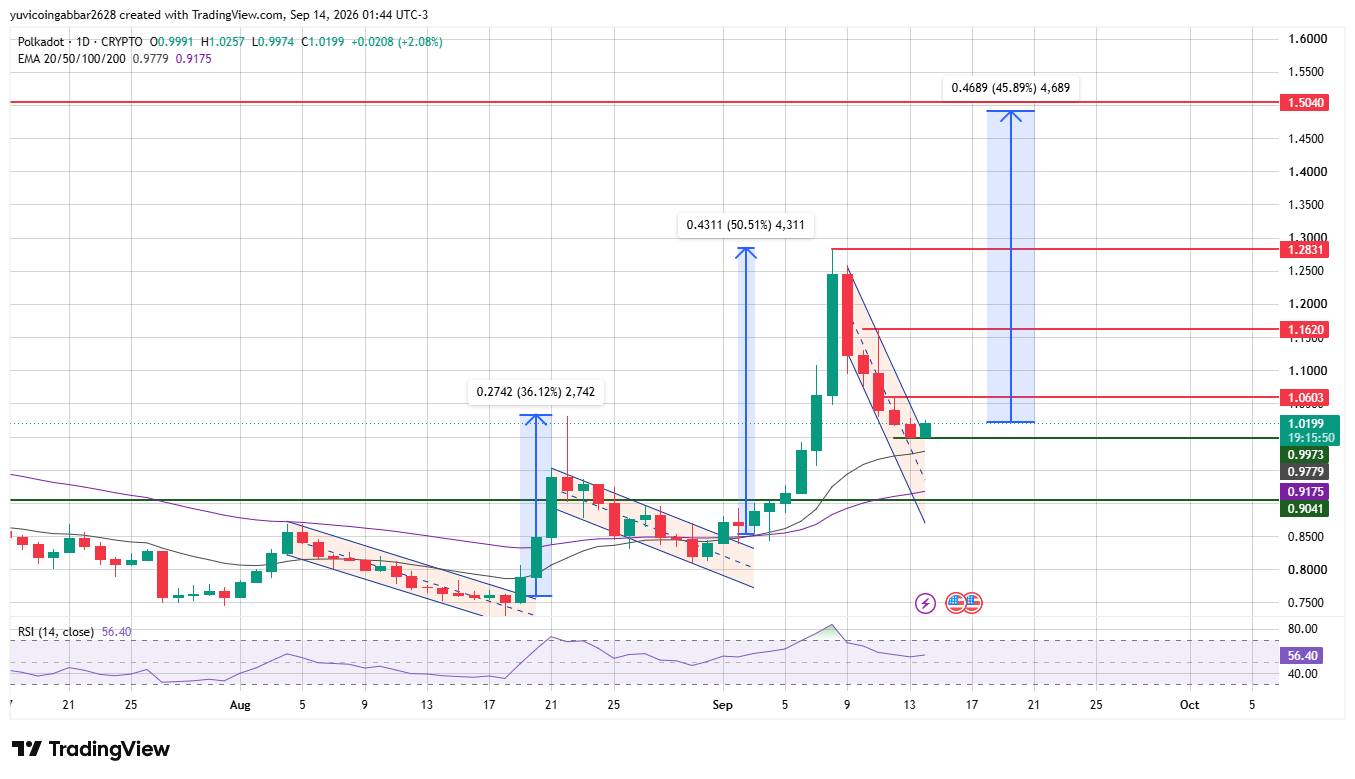
DOT Key Levels to Watch: Polkadot Outlook
Level Type
Price
Resistance 4
$1.5040
Resistance 3
$1.2831
Resistance 2
$1.1620
Resistance 1 (nearest)
$1.0603
Immediate Price Reference
$1.0199
First Confirmed Support
$0.9973
Deeper Support (EMA long zone)
$0.9175
Structural Floor
$0.9041
Polkadot Forecast: Bull Case vs Bear Case
Bull case: Clearing $1.0603 and then $1.1620 would open the path toward $1.2831, and if the chart's projected measured move plays out, eventually toward $1.5040, the same target the pattern itself is flagging.
Bear case: A close below $0.9973 would expose the EMA cluster near $0.9175 and then the structural floor at $0.9041, invalidating the measured-move setup entirely.
Polkadot Price Forecast: $DOT Triggers and Invalidation
Scenario
Trigger
Likely Outcome
Invalidation Point
Measured-move breakout
Close above $1.0603
Push toward $1.1620
Rejection back below $1.0199
Support hold
Bounce from $0.9973
Range continues toward resistance
Close below $0.9973
Support breakdown
Close below $0.9973
Slide toward $0.9175
Reclaim of $0.9973
Polkadot Price Prediction: Can DOT Reach $1.5040?
$1.5040 is the highest resistance marked on the chart, and it lines up with the chart's own projected measured move of about 46%.
Getting there would require DOT to first clear $1.0603, then $1.1620 and $1.2831 in turn, a multi-stage move rather than a single leg.
Polkadot Price Prediction 2026: Expert View
According to CoinGabbar analysts, The measured-move pattern and the treasury funding story are both supportive, but DOT still needs to clear $1.0603 to keep the setup alive.
The $0.9973 to $1.0603 zone is what matters most this week.
Disclaimer
This piece is for informational purposes only and isn't financial advice. The levels and scenarios above are based on technical chart analysis and publicly available data at the time of writing, and crypto markets can move sharply within hours, so past patterns don't guarantee future outcomes. It's worth doing independent research and considering your own risk tolerance before acting on any of the levels discussed here.