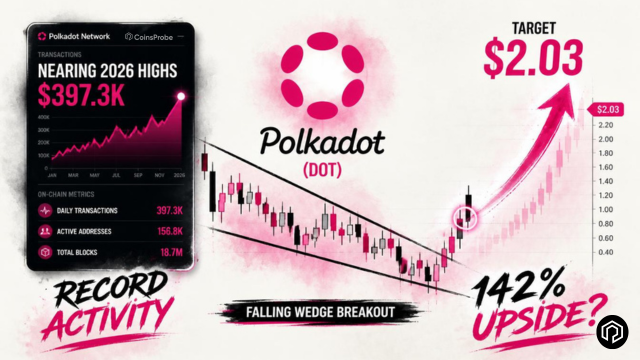
Key Highlights DOT trades near $0.8326, up 4.85% in 24 hours as Layer-1 tokens rally. Polkadot transactions have climbed to nearly 400K, signaling stronger on-chain activity. DOT has broken o
Key Highlights
- DOT trades near $0.8326, up 4.85% in 24 hours as Layer-1 tokens rally.
- Polkadot transactions have climbed to nearly 400K, signaling stronger on-chain activity.
- DOT has broken out of a falling wedge, with a technical target of $2.03 (+142%).
- Bulls need to hold the breakout and reclaim the 100-day MA near $1.02 to confirm further upside.
Polkadot’s +4.85% daily move is not happening in isolation — it is part of a broader rotation back into older-generation Layer-1 tokens that has been one of the more notable developments across the altcoin market in the past 24 hours. The falling wedge breakout and improving network activity give this move a specific analytical foundation beyond pure sector momentum.
DOT is trading near $0.8326 — up +4.85% in 24 hours — with a market cap of approximately $1.41 billion. Despite the near-term recovery, DOT remains -53.46% year-to-date — one of the steeper YTD declines among the major Layer-1 assets — which also means it carries some of the most significant potential upside if the sector rotation develops into a sustained recovery.
 Polkadot (DOT) Price on 04 Aug 2026/Source: Coinmarketcap
Rising Network Activity Approaching March Peak
On-chain data from Artemis provides the fundamental backdrop that gives the technical setup more credibility than a purely price-driven momentum move:
MetricDataDOT transactions (end of July 2026)397,300DirectionContinuing higher2026 peak (March)~444,700Distance to peak~47,400 transactions (-10.7%)
Polkadot’s transaction count reaching 397,300 by the end of July — and continuing to climb — positions the network within striking distance of its March 2026 peak of approximately 444,700. This is the kind of organic, on-chain activity growth that distinguishes a genuine network recovery from a purely price-driven speculative move.
Why approaching the March peak matters:
March 2026 was DOT’s peak network activity month of the year — a period that coincided with a higher price level. The fact that transaction counts are now approaching that same level while price is significantly below the March levels suggests that network usage has shown more resilience than price — a divergence that historically precedes price catching up to on-chain fundamentals rather than on-chain metrics falling back to match price.
Steady, improving transaction counts after a prolonged period of softer metrics signal that Polkadot’s ecosystem is genuinely attracting and retaining users — not just experiencing temporary activity spikes around specific events.
 Polkadot Transactions/Source: artemis
Falling Wedge Breakout
The technical structure providing the specific, level-based framework for DOT’s current move is a falling wedge breakout on the daily chart — the same pattern type we identified for Cardano’s recovery and Dogecoin’s setup in recent coverage.
The falling wedge structure:
DOT’s daily chart formed a falling wedge during the extended corrective phase — with the lower support trendline holding near $0.7424 and the upper resistance trendline capping recovery attempts near $0.7880. The converging trendlines reflected diminishing selling momentum as the correction approached its natural exhaustion point.
The breakout:
DOT has cleared the upper resistance trendline near $0.7880 — the specific technical event that activates the pattern’s measured move. This breakout follows the rebound from the $0.7424 lower support — the floor that held during the pattern’s formation and whose defence was the prerequisite for any bullish resolution.
 Polkadot (DOT) Daily Chart – Coinsprobe/Source: Tradingview
The three-step confirmation sequence:
StepLevelStatusStep 1 — Breakout above upper trendline~$0.7880CompletedStep 2 — Retest of $0.7880 as support~$0.7880Currently developingStep 3 — Reclaim of 100 MA~$1.02Pending
The most important near-term event is the Step 2 retest — where price pulls back toward $0.7880 to test whether the broken resistance has now become support. A successful hold above $0.7880 during this retest would be the cleanest confirmation that the breakout is genuine. A failure to hold — a sustained close back below $0.7880 — would suggest the breakout was a false move requiring reassessment.
The $1.02 100 MA — the critical intermediate gate:
Between the current price and the $2.032 measured move target sits the 100-period moving average at approximately $1.02 — the first major resistance that DOT needs to reclaim to confirm the recovery is developing into a sustained move rather than a brief bounce. A sustained close above the 100 MA would be the technical confirmation that separates a genuine recovery from a temporary counter-trend move.
The $2.032 measured move target:
The falling wedge measured move — projecting the pattern’s height above the $0.7880 breakout level — produces a target of approximately $2.032. From the current price of $0.8326, this represents approximately +142% upside — a meaningful but historically proportionate move for Polkadot from a confirmed falling wedge breakout at this stage of its cycle.
Bullish Scenario
DOT successfully retests the $0.7880 breakout trendline — holding above it with a sustained close — and begins building toward the 100 MA at $1.02. A confirmed reclaim of the 100 MA with rising volume would validate the falling wedge resolution and activate the $2.032 measured move target as the primary destination. This scenario aligns with the broader older L1 rotation narrative and is supported by the improving on-chain transaction count approaching the March peak.
Bearish Scenario
A sustained daily close below the $0.7424 lower wedge trendline — particularly if it follows a failed retest of $0.7880 — would invalidate the falling wedge breakout entirely. This would confirm the correction has not yet found its true bottom and that the pattern requires a reset to a lower base before any genuine recovery can develop.
Bottom Line
Polkadot’s +4.85% move — joining a broad older-generation L1 recovery that has taken ADA, ATOM, ALGO, and AVAX each above +5% in 24 hours — is supported by three converging signals: a sector-wide rotation back into established Layer-1 assets, Artemis on-chain data showing July transactions at 397,300 and approaching the March peak, and a daily falling wedge breakout above $0.7880 with a clear $2.032 measured move target.
The roadmap is sequential and level-based: $0.7880 retest must hold → $1.02 100 MA must be reclaimed → $2.032 activates. The $0.7424 lower trendline remains the invalidation that ends the bullish thesis if broken.
Disclaimer: The views and analysis presented in this article are for informational purposes only and reflect the author’s perspective, not financial advice. Technical patterns and indicators discussed are subject to market volatility and may or may not yield the anticipated results. Investors are advised to exercise caution, conduct independent research, and make decisions aligned with their individual risk tolerance.
Read Also: Will Pi Network (PI) Recover? $10.5M August Unlock Poses Key Test