Polygon is having a massive day. POL just jumped 25%, breaking sharply out of a months-long grind, right as analysts reignite debate over its revenue versus its ranking. This Polygon Price Pr
Polygon is having a massive day. POL just jumped 25%, breaking sharply out of a months-long grind, right as analysts reignite debate over its revenue versus its ranking.
This Polygon Price Prediction covers what's driving the move, what the liquidation data shows, and the levels that matter most right now.
Market data was checked on August 22, 2026, at 14:46 IST.
POL Live Price and Market Stats
Metric
Value
Price
$0.11205
24h Change
+25%
Market Cap
$1.18B
FDV
$1.18B
24h Volume
$330M+
Vol/Mkt Cap (24h)
25.49%
Total Supply
10.7B POL
Circulating Supply
10.7B POL
Holders
251.35K
Source: Data from CoinMarketCap as of August 22, 2026, at 14:46 IST. Figures may vary slightly across other tracking websites.
POL crypto news today: What Analysts Are Saying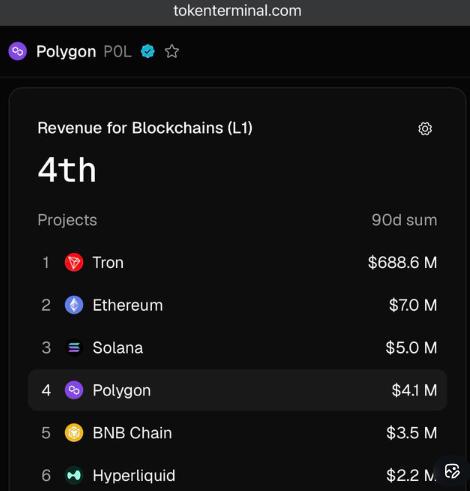
Source: Data From X
Analyst Venturefounder claimed POL is the 4th highest chain by revenue, ahead of BNB and HYPE, yet sits at #58 on CMC due to weak token relations and tokenomics, a sharp contrast to its former MATIC days as a top-10 token.
This is the account's own analysis, not verified $data, and reflects one trader's view on the disconnect between Polygon's usage and its market ranking.
Polygon Ecosystem Liquidation and Volume Data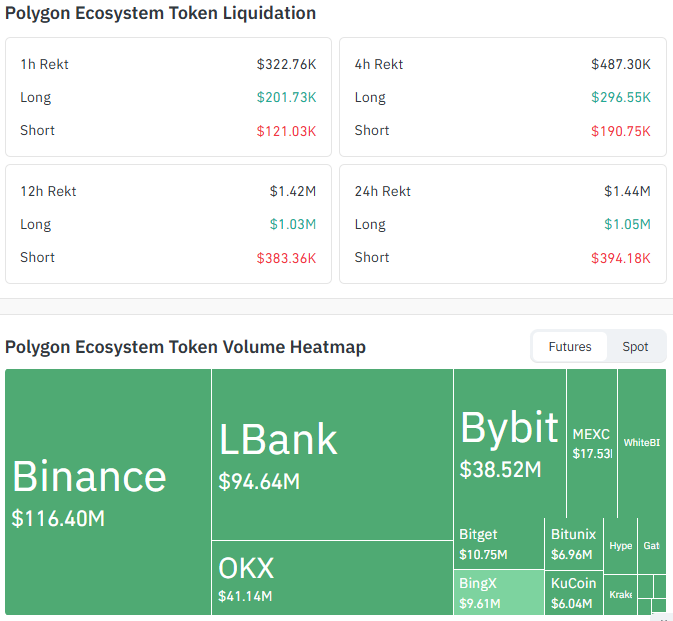
Coinglass data shows long liquidations dominating across every window as leveraged shorts got squeezed by today's breakout.
Timeframe
Total Liquidated
Long Liquidations
Short Liquidations
1h
$322.76K
$201.73K
$121.03K
4h
$487.30K
$296.55K
$190.75K
12h
$1.42M
$1.03M
$383.36K
24h
$1.44M
$1.05M
$394.18K
Exchange volume is led by Binance at $116.40M, followed by LBank at $94.64M, Bybit at $38.52M, OKX at $41.14M, MEXC at $17.53M, and smaller volume across Bitget, Bitunix, BingX, and KuCoin.
This heatmap reflects Polygon ecosystem token futures activity, separate from spot volume in the market overview above.
$POL Price Prediction Chart: Technical Analysis
Pair: POL/USDT · Market: Spot (Crypto) · Exchange: OKX · Timeframe: 1D · Source: TradingView · Timestamp: August 22, 2026, 14:46 UTC+5:30
POL broke out sharply from the 0.09355 - 0.10479 range, spiking to a high of $0.12133 before settling at $0.11205, up 25% on the current candle after months of decline since January.
If the price holds the current support levels and builds liquidity around them, it could create a stronger base for further upside.
However, sustaining the bullish momentum will also depend on the broader altcoin market maintaining its strength as the RSI sits at 88.94, extremely overbought, signaling a stretched move.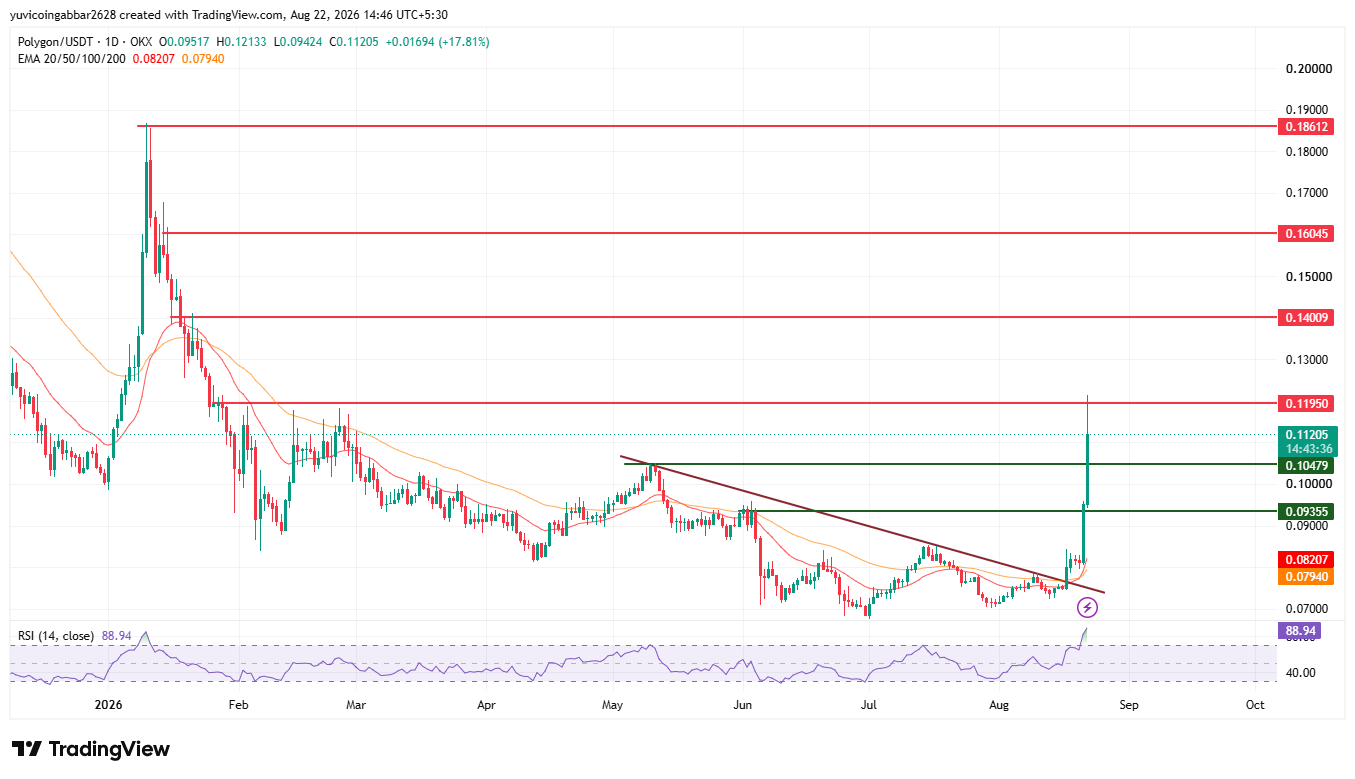
POL future price: Support and Resistance Levels
Level Type
Price
Resistance 4
$0.18612
Resistance 3
$0.16045
Resistance 2
$0.14009
Resistance 1
$0.11950
Immediate Price Reference
$0.11205
First Support
$0.10479
Deeper Support
$0.09355
Polygon crypto forecast: Bull Case vs. Bear Case
$POL price target 2026 Bull case: Holding above $0.10479 keeps today's breakout intact.
A close above $0.11950 opens the path toward $0.14009 and $0.16045.
$POL price target 2026 Bear case: A break below $0.10479 would suggest the rally is fading, especially with RSI this extreme.
Losing $0.09355 puts the breakout in serious doubt.
$POL price target: POL Price Prediction Scenarios
Scenario
Trigger
Likely Outcome
Invalidation Point
Breakout continuation
Close above $0.11950
Move toward $0.14009
Rejection at $0.11950
Range hold
Price holds 0.10479–0.11950
Consolidation before next leg
Break outside either bound
Breakout failure
Close below $0.09355
Retest of EMA zone near 0.079–0.082
Reclaim of $0.10479
Can $POL Reach $0.18612?
$0.18612 is the highest marked resistance.
Reaching it needs POL to clear $0.11950, $0.14009, and $0.16045 in sequence, a multi-stage move, especially with RSI already at an extreme 88.94.
Polygon Price Prediction: Expert View
According to CoinGabbar analysts, today's breakout came on heavy volume and a decisive break of the multi-month range, alongside renewed debate over Polygon's revenue-to-ranking gap.
RSI near 89 signals the move is extremely stretched, so a cooldown looks likely before any further push.
The $0.10479 to $0.11950 zone is the key range to watch next.
Disclaimer: This piece is for informational purposes only and isn't financial advice. Levels and scenarios are based on technical chart analysis and public data at the time of writing; markets can move sharply within hours. It's worth doing independent research and considering your own risk tolerance before acting on any levels discussed here.