Pudgy Penguins started out as an NFT collection built around a well-known penguin character design, growing a large community before expanding into the token economy with the launch of $PENGU
Pudgy Penguins started out as an NFT collection built around a well-known penguin character design, growing a large community before expanding into the token economy with the launch of $PENGU.
The project has leaned into mainstream partnerships and merchandising alongside its crypto presence, helping it stand out from typical meme coins.
$PENGU is trading around$0.00788, up 14.4% in the past 24 hours.
Live Market Data
Here's the live snapshot behind this pudgy penguins price prediction as of writing.
Metric
Value
Price
$0.007763
24h Change
+14.4%
Market Cap
$487.986M
Fully Diluted Valuation
$595.6M
24h Trading Volume
$181.689M
Circulating Supply
62.86B
Total Supply
76.723B
Max Supply
88.889B
Source: $PENGU market cap data taken from Coingecko, data as of Aug 21, 2026. Figures may vary slightly across other tracking websites.
Liquidation Snapshot
Pudgy Penguins' derivatives market has been active through this breakout.
Over the past 24 hours, $998.64K in positions got liquidated, with shorts taking the bulk at $842.10K against $156.54K on longs, lining up with a move that caught short sellers off guard. 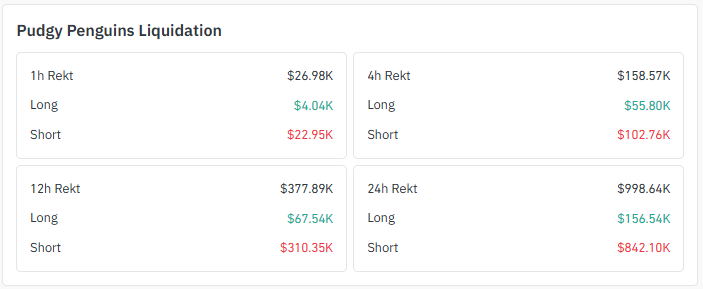
Source: Liquidation Data Taken From Coinglass.
The 12-hour window shows a similar tilt, with $310.35K in short liquidations against $67.54K on longs, and the pattern holds even over the last hour, with shorts eating $22.95K of the $26.98K total wiped out.
Exchange Volume
Exchange
24h Volume
Binance
$118.98M
OKX
$48.20M
Bybit
$39.17M
MEXC
$15.54M
Hyperliquid
$15.09M
Bitget
$10.03M
Gate
$9.07M
WhiteBIT
$6.55M
Bitunix
$6.09M
KuCoin
$6.62M
BingX
$4.90M
Source: Volume Heatmap Data Taken From Coinglass.
Key Takeaways
PENGU broke out of a descending triangle on the daily chart, and this pudgy penguins price prediction leans bullish as price now tests the resistance levels above.
Price is trading near $0.00788, up 14.4% over the past 24 hours.
Hold momentum, and the price could clear resistance toward $0.009494, then $0.010719 as the bigger level.
Get rejected at the first resistance, and sellers stepping in could send the price back toward the $0.006824 support shelf.
24-hour liquidations hit $998.64K, and shorts took the bigger hit here at $842.10K.
Technical Analysis: Daily Chart Analysis
$PENGU spent a stretch grinding sideways just above support while a descending trendline pressed down from above, forming a classic descending triangle on the daily chart.
That kind of squeeze between flat support and falling resistance usually resolves with a decisive move once one side finally gives way.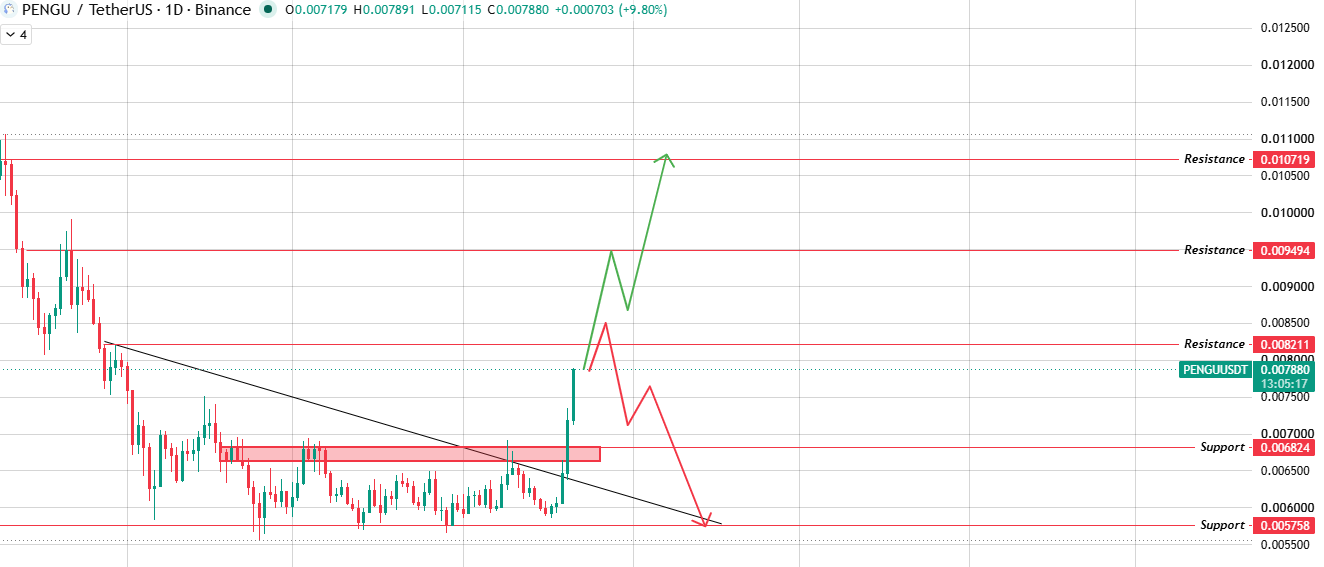
Source: Chart Taken From TradingView.
Here, the breakout confirmed to the upside, with the price clearing the triangle structure and pushing toward the resistance zone above.
If momentum keeps building, this pudgy penguins price prediction points toward $0.009494 first, then $0.010719, as the bigger level if buyers stay in control.
If instead the price gets rejected at the first resistance around $0.008211 and sellers become active again, a pullback toward the $0.006824 support becomes the more likely path.
Support and Resistance Levels
Chart-derived levels are shaping this pudgy penguins price prediction right now.
Type
Level
Resistance
0.010719
Resistance
0.009494
Resistance
0.008211
Current Price
0.007880
Support
0.006824
Support
0.005758
Bull, Base, Bear Case
This pudgy penguins price prediction breaks into three scenarios depending on how the price handles the resistance levels above the triangle breakout.
Case
level
Setup
Invalidation
Bull
0.010719
Triangle breakout holds, and momentum carries price through both nearer resistance levels.
Daily close back below 0.006824
Base
0.008211
First resistance right above the current price, a natural pause after the breakout
Loss of the 0.007300 area on a daily close
Bear
0.006824
Rejection at first resistance brings sellers back in, and the price falls toward the old support shelf.
Daily close under 0.005758
Glossary
Descending Triangle: A chart pattern where price compresses between flat support and a falling resistance line, often resolving with a breakout in either direction.
Triangle Breakout: The moment the price finally clears one side of a converging triangle structure, confirming the next directional move.
Liquidation: The forced closing of a leveraged position once losses eat through a trader's available margin.
Rejection: When a price approaches a resistance level and gets pushed back down rather than breaking through it.
Market Cap: A coin's price multiplied by its circulating supply, used to gauge overall size relative to other assets.
Methodology
This pudgy penguin's price prediction draws on multi-source data, including daily timeframe chart structure, live liquidation figures, and current market data.
Price levels referenced here come directly from chart structure rather than extrapolation.
Exchange volume data was excluded from this update due to a data mismatch and will be added once verified figures are available.
Markets move fast, so treat these levels as a framework rather than a fixed outcome.
Disclaimer: This article is for informational purposes only and does not constitute financial advice. Cryptocurrency markets, including Pudgy Penguins, are highly volatile and carry significant risk. Always do your own research and consult a licensed financial advisor before making investment decisions.