PENGU trades near $0.0097 on Oct 1, 2026, down 1.96% in 24 hours. Price keeps pressing the top of a descending channel. This Pudgy Penguins price prediction maps October 2026 levels using dat
PENGU trades near $0.0097 on Oct 1, 2026, down 1.96% in 24 hours. Price keeps pressing the top of a descending channel.
This Pudgy Penguins price prediction maps October 2026 levels using data from around 09:05 UTC, while longer-rangePENGU forecasts cover later years.
But the setup needs a breakout to matter.
PENGU Price Snapshot
The PENGU price stood at $0.009704 at around 09:05 UTC, according to CoinMarketCap price data. That ranks Pudgy Penguins #85.
The 24-hour range ran from $0.009474 to $0.01053. And the price trades 83.17% below the all-time high of $0.05738, set Dec 17, 2024.
Far from it.
Market Cap and Supply
Market capitalization is $610.05M on 62.86B circulating tokens. Fully diluted valuation (FDV, the value if max supply were circulating) is $862.65M, which is 41.4% higher.
Max supply is 88.88B PENGU. Related token coverage sits inmemecoin market news.
Remaining Supply Overhang
Total supply is 76.72B, while circulating supply is 62.86B. That leaves 13.86B tokens outside circulation. Unlock schedule: data not available.
Early distribution included an airdrop, and supply from programs listed undercrypto airdrops can reach exchanges fast.
Derivatives Data
CoinGlass derivatives data showed open interest at $145.86M and 24-hour futures volume at $278.52M. Spot volume on the same page reads $63.63M.
Futures volume ran 4.4x spot. Derivatives trading outweighs spot activity.
Liquidations and Positioning
Liquidations totaled $639.97K over 24 hours, with longs at $457.40K, a 71.5% share. Binance top trader positions showed a long/short ratio of 3.2368.
Crowded longs. Fragile if $0.0106 rejects again.
Holder Concentration
Solscan holder data lists 560,852 holders on Solana, while CoinMarketCap reports 876.99K. Counting methods likely differ.
The top 10 wallets own 45.14% of the supply, and the top 100 own 80.95%. Solscan tags 159 whale wallets with 36.21%.
Concentrated supply amplifies moves in both directions.
Exchange Liquidity
Binance PENGU/USDT led spot trades with $20.82M in 24-hour volume and $490,131 of depth within 2% above price. Upbit PENGU/KRW added $7.12M.
Liquidity equals 1.94% of market cap, against a 38.88% volume ratio. Venue changes appear inexchange listing updates.
Korea Launches Catalyst
LINE FRIENDS launch goes live today. Seoul. Myeongdong flagship store. Oct 1, 2026.
Pudgy Penguins promoted the event on X during Korea Blockchain Week. Opening time isn't stated in the posts.
Upbit already trades $PENGU/KRW. Korean liquidity is in play. Dates for similar events sit on thecoin events calendar.
Ali Charts Analyst View
Ali Charts counted 3 attempts to clear $0.0106 in anX analyst post.
Repeated tests can weaken resistance, per the post, with $0.0153 as the breakout target. That target sits 57.7% above the current price.
An opinion, not confirmation.
Technical Analysis: Descending Channel Structure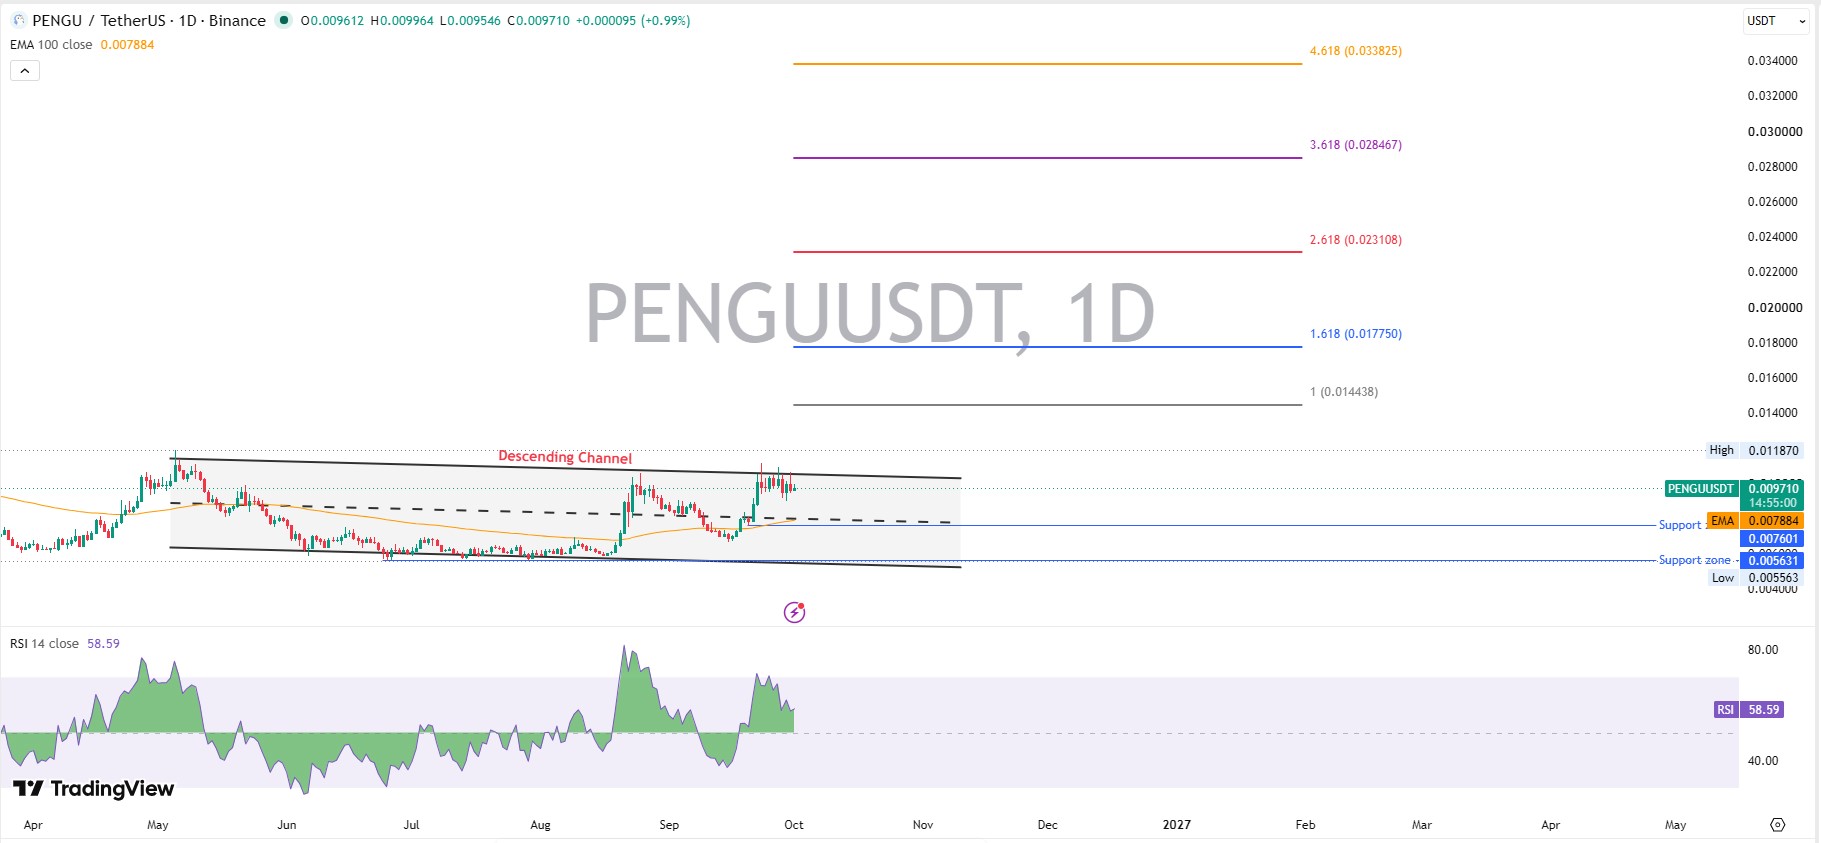
$PENGU technical analysis starts with the descending channel that has framed PENGUUSDT on the daily chart since May. Resistance sits near $0.0106, and the 24-hour high of $0.01053 stopped just below it.
A PENGU descending channel breakout needs sustained trades above $0.0106, a move of 9.2%. Can a 4th test succeed where 3 failed?
PriorPENGU chart test coverage is available for reference.
Support and Resistance Levels
$PENGU support and resistance start with the 100-day EMA at $0.007884, 18.8% below price. And a break under $0.007601 would expose $0.005631.
Resistance stacks at $0.0106 and the prior high of $0.01187. There's more on a past retreat inearlier pullback analysis.
RSI and MACD Reading
RSI reads 58.59 on the daily chart at 09:05 UTC.
That's above 50 and under the 70 overbought line, so room remains for a move before readings overheat.
MACD reads 0.000545 against a signal line of 0.000467.
The histogram sits at 0.000078 and has narrowed. And that fading gap points to slowing momentum. But the bullish crossover remains intact.
Fibonacci Extension Targets
Fibonacci extensions sit at $0.014438, $0.017750, and $0.023108 on the chart.
At 62.86B circulating tokens, $0.014438 implies roughly $907.6M in market cap. And $0.017750 implies $1.12B.
PENGU Price Prediction October 2026
PENGU price prediction October 2026 scenarios rely on the daily chart, the 100-day EMA, and Fibonacci levels at 09:05 UTC.
Bull:sustained trades above $0.0106 on rising volume could expose $0.01187 and $0.014438. Invalid below $0.007884.
Base:a range between $0.007884 and $0.0106 if the 4th test fails, supported by the narrowing MACD histogram. A break of either edge ends it.
Bear: trades under $0.007601 expose $0.005631, with fading momentum as support. Invalid above $0.0106.
The bias stays mildly bullish above $0.007884. Below it, bearish.
Sector Rotation Risk
Capital rotation between narratives, including AI tokens inAI crypto news, can drain memecoin liquidity.
A rotation would show first in falling 24-hour volume, now $236.83M.
New Token Supply Risk
Fresh launches compete for the same speculative funds, andpresale and ICO listings show how often new tokens arrive.
Release of the 13.86B tokens outside circulation would add supply pressure if demand doesn't keep pace. Technical indicators are evidence, not certainty.
Disclaimer: This article is for informational purposes only and isn't financial advice. Crypto trading carries high risk, including total loss of capital. Prices change fast, so live sources should be verified before any decision.