PUMP breakout confirms trend reversal after prolonged descending channel structure. RSI nears the overbought zone while MACD supports ongoing bullish momentum. Price holds above trendline res
- PUMP breakout confirms trend reversal after prolonged descending channel structure.
- RSI nears the overbought zone while MACD supports ongoing bullish momentum.
- Price holds above trendline resistance, with continuation dependent on support retest.
PUMP breakout momentum continues following a sharp rally, as price action moves above key resistance levels with rising volume, while traders assess sustainability after a strong expansion phase.
Breakout Structure Signals Trend Shift
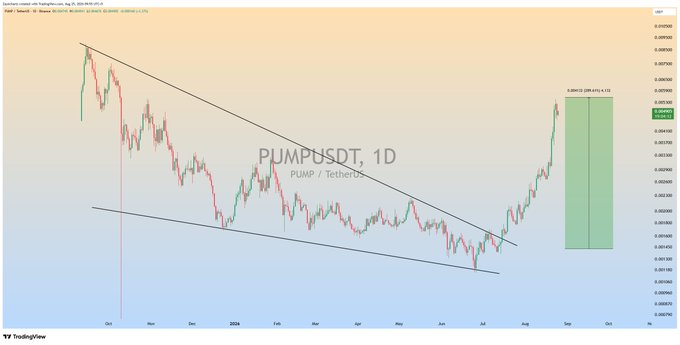
The PUMP breakout follows a prolonged descending channel formation. Price respected lower highs and compressed within declining resistance boundaries. This pattern reflects extended bearish control before the recent shift.
A tweet from ZAYK Charts identifies the bullish wave development. The structure shows price moving beyond long-standing resistance levels. This transition marks a change from compression toward expansion.
Source:
XPrice action accelerated after breaking the upper trendline resistance. Momentum candles formed with limited pullbacks during the advance. This movement confirms increased participation during the breakout phase.
The structure now reflects a completed reversal from prior downtrend. Holding above the breakout zone becomes the next structural requirement. Failure to maintain this level may weaken continuation signals.
Momentum Indicators Reflect Strength
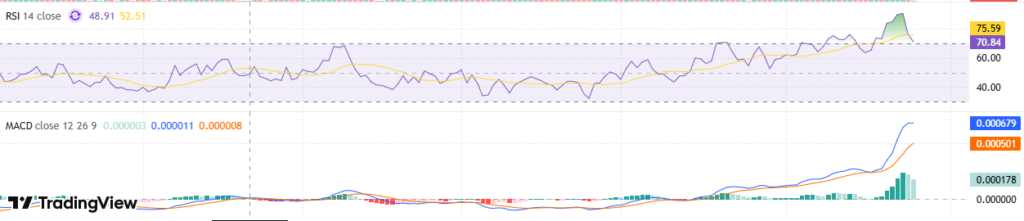
The PUMP breakout aligns with strong momentum indicator readings. RSI currently trades near the 70-75 range. This level places the indicator within the overbought region.
Source:
TradingviewRSI movement has remained steady rather than sharply extended. This behavior suggests controlled momentum rather than excessive speculation. A slight decrease in flatness means that the acceleration is decreasing upward.

There is a definite bullish cross over by MACD. The indicator does not fall below the signal line and the zero level. Histogram expansion reflects strengthening directional momentum.
Combined signals show alignment between trend and momentum indicators. RSI tracks momentum speed while MACD confirms directional strength. This combination supports continuation under stable conditions.
Price Action and Short-Term Outlook
The PUMP breakout has driven the price to $0.004568 as of the time of writing. This level follows a strong weekly increase of nearly sixty-nine percent. However, the asset shows a short-term daily decline.
Such pullbacks often occur after rapid vertical price movements. Markets tend to pause or retrace before continuing higher. This behavior allows momentum indicators to reset gradually.
The breakout zone now acts as a potential support area. Price stability above this region supports continuation structure. A breakdown could signal a shift toward consolidation.
Traders monitor volume behavior during any retest phase. Sustained activity would confirm continued buyer participation. Lower volume may indicate weakening short-term demand strength.