The Pump.fun price prediction October 2026 debate opens with a strong volume claim and a weak price. A post says PumpSwap led all Solana DEXs with $15 billion in September trading volume, yet
The Pump.fun price prediction October 2026 debate opens with a strong volume claim and a weak price. A post says PumpSwap led all Solana DEXs with $15 billion in September trading volume, yet PUMP is down 3.8% over 24 hours.
Pump.fun is a Solana-based launchpad that lets anyone create and trade a memecoin in minutes.
It launched in January 2024, introduced its own DEX, PumpSwap, in 2025, and its PUMP token began trading in July 2025.
For the latestPump.fun price today, the PUMP coin trades at $0.005521, down 3.8% over 24 hours. It ranks #42 by market cap at $2.566B, and its 24-hour range runs from $0.005172 to $0.006179.
Pump.fun Live Data
Metric
Value
Price
$0.005521
24h Change
-3.8%
24h Range
$0.005172 - $0.006179
Market Cap
$2.566B
Market Cap Rank
#42
Source: market data taken from CoinGecko, as of Oct 3, 2026. Figures may vary slightly across other tracking websites.
Pump.fun (PUMP) News Today
The latestPump.fun news is a post from the SolanaNews.sol account. It claims Solana DEX volume jumped 20% to $78 billion in September, with PumpSwap leading all Solana DEXs at $15 billion.
At that level, PumpSwap would hold about 19.2% of the total, and the 20% jump implies August volume near $65 billion.
The post attaches a bar chart of top Solana DEX venues, but the labels are too small to verify in the screenshot.
It also names no data source, so readers should confirm the figures on a DEX data tracker before relying on them.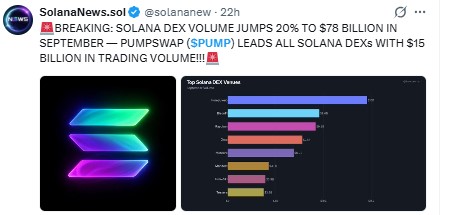
Source: Data Taken From @solananew, as of Oct 3, 2026
Strong volume has not lifted the token, since PUMP is down 3.8% on the day. PumpSwap volume does not move the PUMP price by itself. Traders would need to see how that volume turns into revenue or buybacks.
Pump.fun (PUMP) Technical Analysis
ThisPump.fun technical analysis uses the 4-hour (4H) PUMPUSDT chart on Binance, captured at 16:01 IST on October 3, 2026.
The current 4H candle was still open at capture and closes at about 17:30 IST (12:00 UTC).
Price trades above a rising trendline that began at the late September low.
The rally ran from the September 24 low to a high on September 30, and the price has since moved sideways below the early-October highs.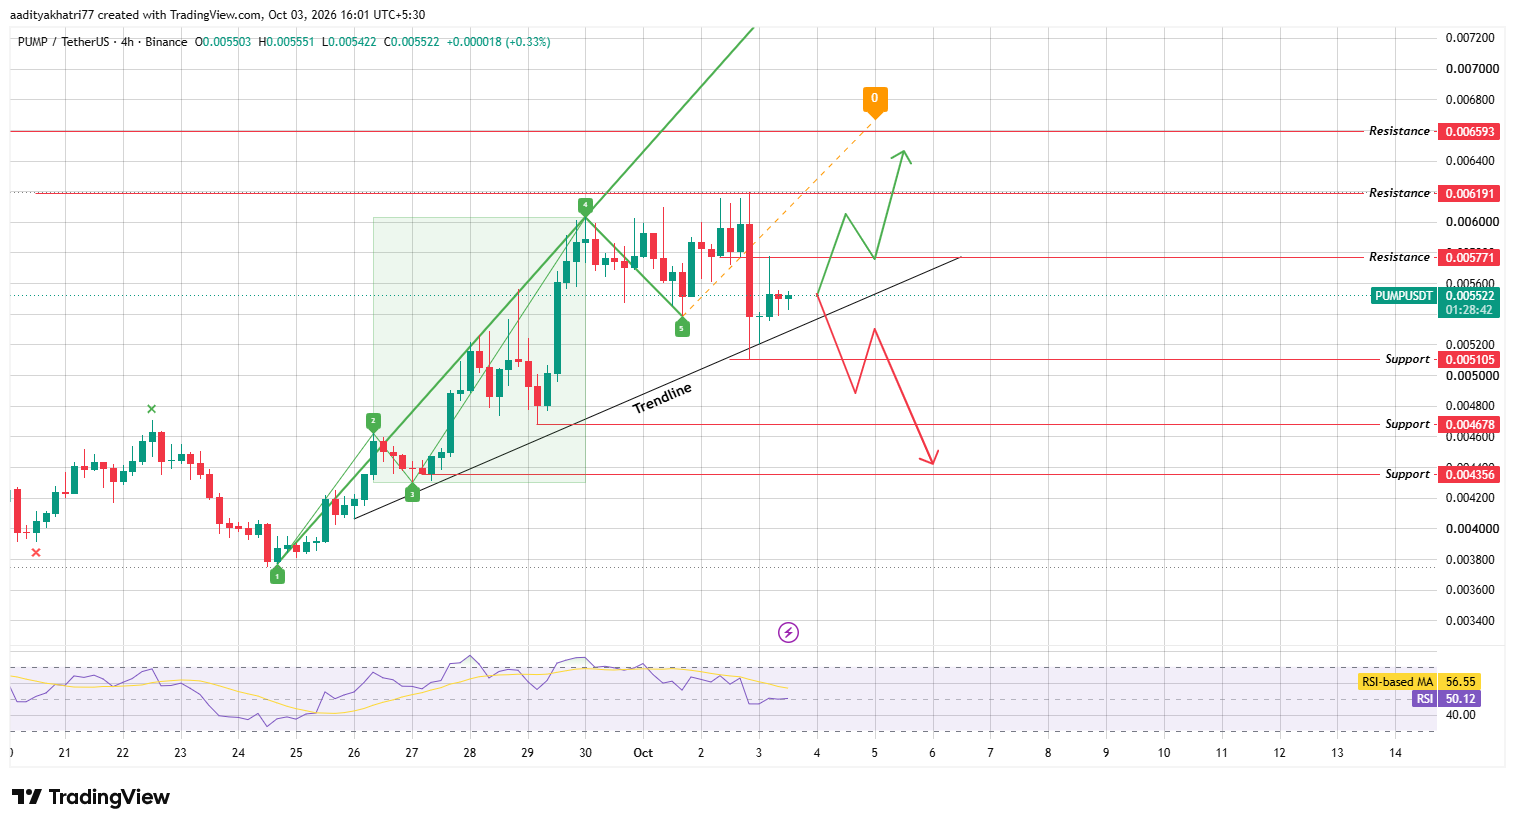
Source:Chart taken from TradingView, Binance PUMPUSDT, October 3, 2026
A long red candle on October 2 to 3 dropped from near $0.0060 to the area of the $0.005105 support and the rising trendline, and the price then recovered.
At capture, the price sat at $0.005522, about 4% above the trendline, which runs just under $0.0053 on this chart.
The chart also marks a Wolfe wave, a five-point pattern. Its points run from the September 24 low to the October 1 to 2 low, and its projection line points upward toward the $0.006593 resistance.
Until the price breaks $0.005771 with volume, the pattern stays unconfirmed.
The RSI reads 50.12 and sits below its moving average at 56.55. That points to neutral momentum that has cooled from earlier in the rally.
Can Pump.fun Push Toward Higher Resistance?
Thebullish case starts with the price holding above the rising trendline and bouncing. The first test is the $0.005771 resistance, about 4.5% above the current price.
A real breakout needs a 4H candle close above $0.005771, with volume at least 1.5 times the average of the previous 20 candles. A close on weaker volume would leave the move open to a fade.
If that happens, the next stop is $0.006191, roughly 12.1% higher and close to the 24-hour high of $0.006179. A further push could reach $0.006593, a gain near 19.4%.
That is also where the Wolfe wave projection ends, so a confirmed breakout would give the pattern a clear target.
What Happens If Pump.fun Breaks Support?
The weaker path begins if the price loses the rising trendline. The $0.005105 support sits just beneath it, about 7.6% below the current price.
A 4H close below $0.005105 on the same 1.5x volume threshold would confirm a breakdown and put the price under the rising trendline. That would also cancel the upward Wolfe wave reading.
The next supports are $0.004678, about 15.3% lower, and $0.004356, near 21.1% below the current price.
The RSI below its moving average gives the setup a cautious lean until a resistance break proves otherwise.
Price Levels to Watch
Support
Resistance
$0.005105
$0.005771
$0.004678
$0.006191
$0.004356
$0.006593
Bull, Base, and Bear Scenarios
Scenario
Setup
Level
Bull
Bounce above the rising trendline, 4H close above $0.005771 with rising volume
$0.006191, then $0.006593
Base
The price holds above the rising trendline and stays below resistance.
$0.005105 - $0.005771
Bear
4H close below $0.005105 and the rising trendline with rising volume
$0.004678, then $0.004356
Pump.fun vs Bitcoin
PUMP fell 3.8% in dollar terms and 1.9% against Bitcoin. That gap implies Bitcoin also dropped by roughly 1.9%, so about half of PUMP's decline tracks the wider market.
The other half belongs to PUMP itself, which fits a token that gave back part of its early-October highs.
A steadierBitcoin price would help price hold the rising trendline, while a deeper BTC pullback would put the $0.005105 support in play.
Methodology
ThisPump.fun price forecast relies on three sources. Price levels, the rising trendline, the Wolfe wave, and the RSI come from the Binance PUMPUSDT 4H chart on TradingView.
Market data comes from CoinGecko, and the news item comes from a public X post.
Every level is tied to 4H candles, so a signal counts only after a full candle close. Percentage moves in this Pump.fun price prediction are measured from the chart price of $0.005522.
The trendline level is read from the chart and is approximate. We treat the unverified DEX volume claim as a headline, not as an input to any scenario.
Expert Opinion
General market commentary on PUMP often links the token to launchpad activity, so volume headlines draw a lot of attention.
Those headlines matter more when they show up in PUMP's own chart volume, which is what the 1.5x threshold above is designed to check.
On this chart, the first decision points are $0.005771 on the upside and $0.005105 on the downside. The Wolfe wave target near $0.006593 only becomes relevant if the first one breaks with volume.
For now, the price remains above the rising trendline, but the cooling RSI keeps the setup short of a clear signal.
Disclaimer:This article is for information only and is not financial advice. Crypto prices are volatile, and the Solana DEX volume figures come from an unverified social post. PUMP can fall below every support level named here, and a failed breakout can reverse quickly. No scenario is guaranteed, and readers should research independently and invest only what they can afford to lose.