PUMP has been climbing inside a well-defined ascending channel for weeks, and in its most recent session it finally tried to break out above it. The move didn't stick; the price slipped back
PUMP has been climbing inside a well-defined ascending channel for weeks, and in its most recent session it finally tried to break out above it.
The move didn't stick; the price slipped back inside the channel almost as quickly as it escaped, leaving traders to decide whether this was a false start or simply a pause before the next push.
With RSI creeping toward overbought territory and a fresh wave of token buybacks adding fuel to the story, thisPUMP price prediction breaks down what a confirmed close above the channel would mean and what could happen if buyers can't hold the line.
Why Is PUMP's Price Moving Today?
The CoinMarket data shows PUMP is trading at $0.003008, up 8.05% over the past 24 hours, though it has pulled back 2.69% in the last four hours as the failed breakout cools off.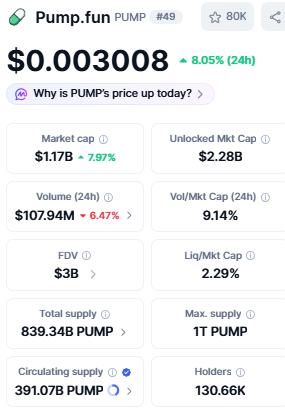
Market cap has risen to $1.17B, up 7.97%, while circulating supply stands at 391.07B PUMP out of a total supply of 839.34B and a max supply of 1T.
24-hour trading volume sits at $107.94M, down 6.47% from the prior session, putting the volume/market cap ratio at 9.14%. Holder count has grown to 130.66K addresses.
What's Driving the Buyback Narrative?
Beyond price action, PUMP's ongoingbuyback-and-burn program continues to gather pace.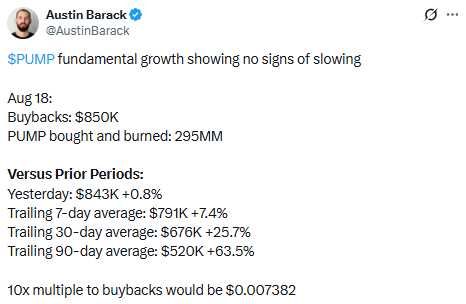
On August 18, the project bought back roughly $850K worth of PUMP and burned close to 295 million tokens, essentially in line with the prior day's $843K.
More telling is the trend: the trailing 7-day average buyback figure is up 7.4% versus the prior period, the 30-day average is up 25.7%, and the 90-day average is up 63.5%, asteady acceleration in buyback activity.
At the current pace, a 10x step-up in buybacks would put the effective figure near $0.007382, underscoring how much room the program still has to scale.
What Are Futures Traders Signalling?
The CoinGlass data shows open interest has surged to $258.62M as of the latest reading, jumping sharply after ranging mostly between $100M and $200M through July and much of August.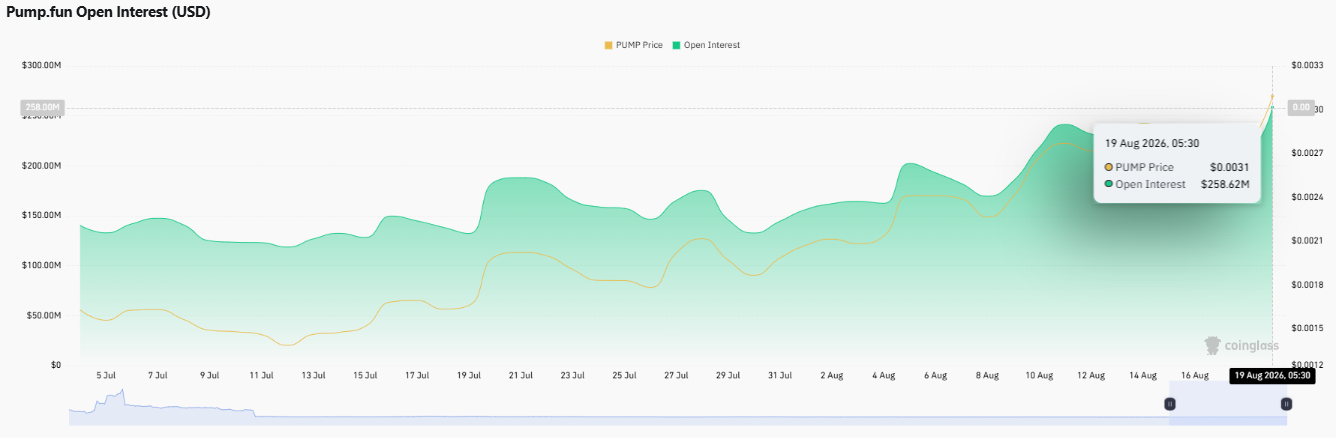
That kind of spike alongside a rising price typically reflects fresh leveraged buying rather than short covering.
Liquidations tell a similarly one-sided story over the past day: of the $1.15M in PUMP positions liquidated in the last 24 hours, $966.86K came from shorts against just $185.16K from longs, showing shorts have been squeezed hard as price pushed higher.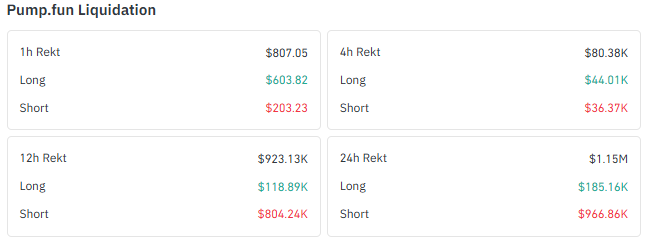
That pattern holds over the 12-hour window too, where short liquidations of $804.24K dwarfed long liquidations of $118.89K. Only in the very short 1-hour and 4-hour windows does the split narrow, with both sides seeing liquidations in closer proportion.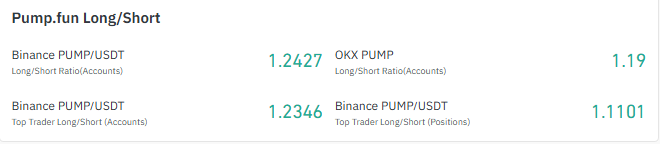
Positioning data leans bullish across the board: Binance's PUMP/USDT long/short ratio across all accounts stands at 1.2427, OKX shows a similar 1.19 reading, and Binance's top trader accounts sit at 1.2346.
Even by position size, top trader long/short positioning remains long-skewed at 1.1101, pointing to broad-based bullish leverage rather than a one-sided retail trade.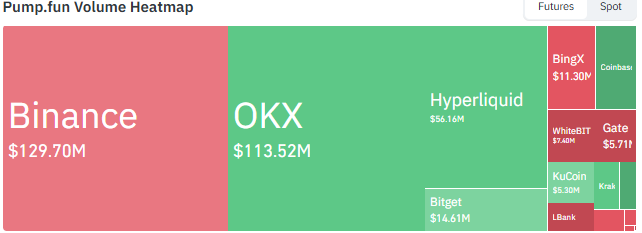
Trading volume is led by Binance at $129.70M and OKX at $113.52M, withHyperliquid contributing $56.16M and smaller volumes from Bitget, BingX, WhiteBIT, Gate, KuCoin, Coinbase, Kraken, and LBank rounding out the rest.
Did PUMP's Breakout Attempt Confirm?
The TradingView chart shows PUMP has spent the past several weeks trading inside a clearly defined ascending channel, and its most recent session finally pushed a green candle above the upper boundary of that structure.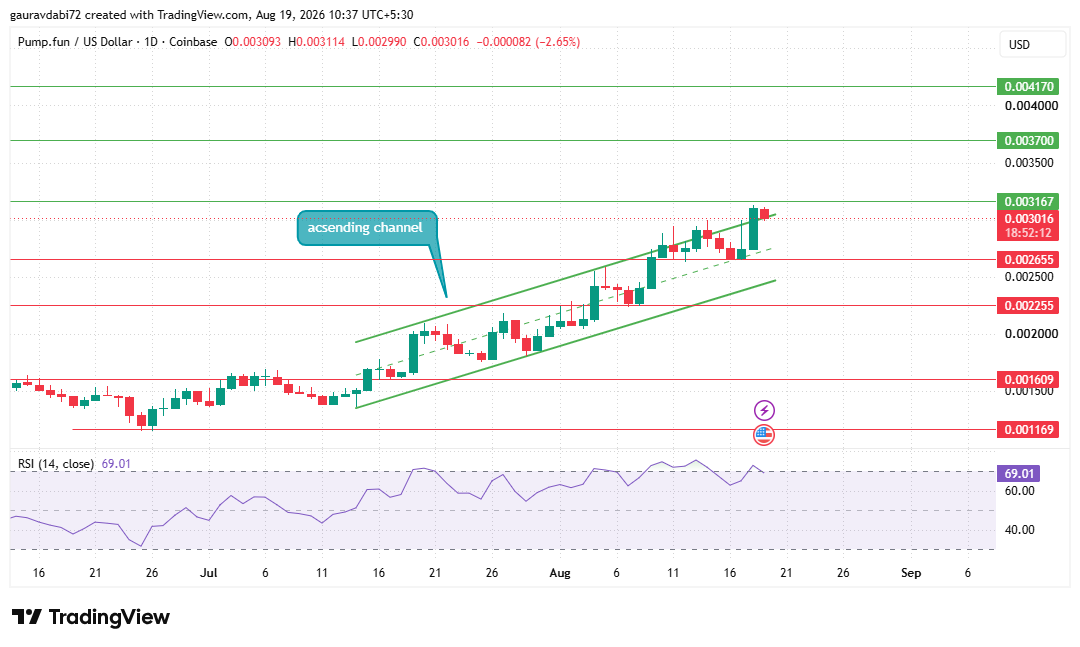
The very next candle, however, turned red and pulled straight back to that same boundary, leaving price sitting right on the channel line rather than clearly holding above it or slipping back inside.
That makes this a retest in progress, not a confirmed breakout and not a clean rejection either.
Per proper market structure, only a candle that closes and holds above the channel line, ideally followed by a successful retest from above, would confirm this as a genuine buyers' zone.
Until that plays out, the level has to be treated as a boundary still being fought over, not one that's been decisively broken.
Where Are the Key Support and Resistance Levels?
On the upside, the nearest resistance sits at $0.003167, followed by $0.003700 and $0.004170 if momentum extends further.
On the downside, support levels line up at $0.002655, $0.002255, $0.001609, and $0.001169.
RSI(14) is currently at 69.01, edging close to overbought territory, which suggests the rally still has some room left but is no longer in its early stage.
PUMP Price Prediction: Bull, Neutral, and Bear Scenarios
Scenario
Key Levels
Bullish
A confirmed daily close above the ascending channel and $0.003167 opens the path toward $0.003700, then $0.004170.
Neutral
Price continues to oscillate within the $0.002655–$0.003167 zone without a confirmed close outside the channel.
Bearish
A break below $0.002655 exposes $0.002255, then $0.001609 and $0.001169 as deeper supports.
The CoinGlass data shows that as of Aug. 19, PUMP's performance across timeframes shows a token still working to recover lost ground even as its short-term trend improves.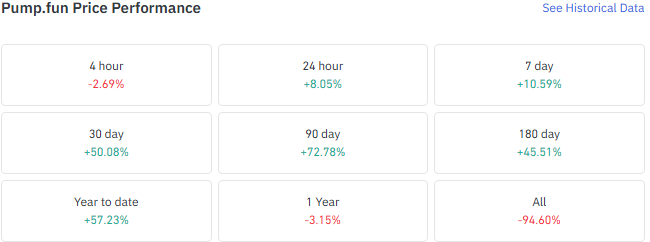
It's up 10.59% over the past seven days and 50.08% over the past 30 days, extending to a 72.78% gain over 90 days.
Over six months PUMP is up 45.51%, and it has gained 57.23% year-to-date.
The picture looks very different over longer horizons, though: PUMP is still down 3.15% over the past year and remains 94.60% below its all-time levels.
What We're Watching Next
As per the CoinGabbar analyst, the combination of an unconfirmed breakout, accelerating buyback activity, and broadly long-leaning derivatives positioning paints a picture of a market that wants to go higher but hasn't yet proven it can.
Analysts would typically want to see the failed breakout followed relatively quickly by a successful retest, since repeated rejections at the same boundary tend to weaken the setup over time.
The scale of short liquidations over the past day suggests momentum traders are already leaning into the bullish case, which cuts both ways; it canextend the move, but it also raises the risk of a sharper unwind if buyers fail to follow through.
Disclaimer: This article is for informational purposes only and should not be considered financial or investment advice. Cryptocurrency markets are highly volatile and carry significant risk; please conduct your own research before making any investment decisions.