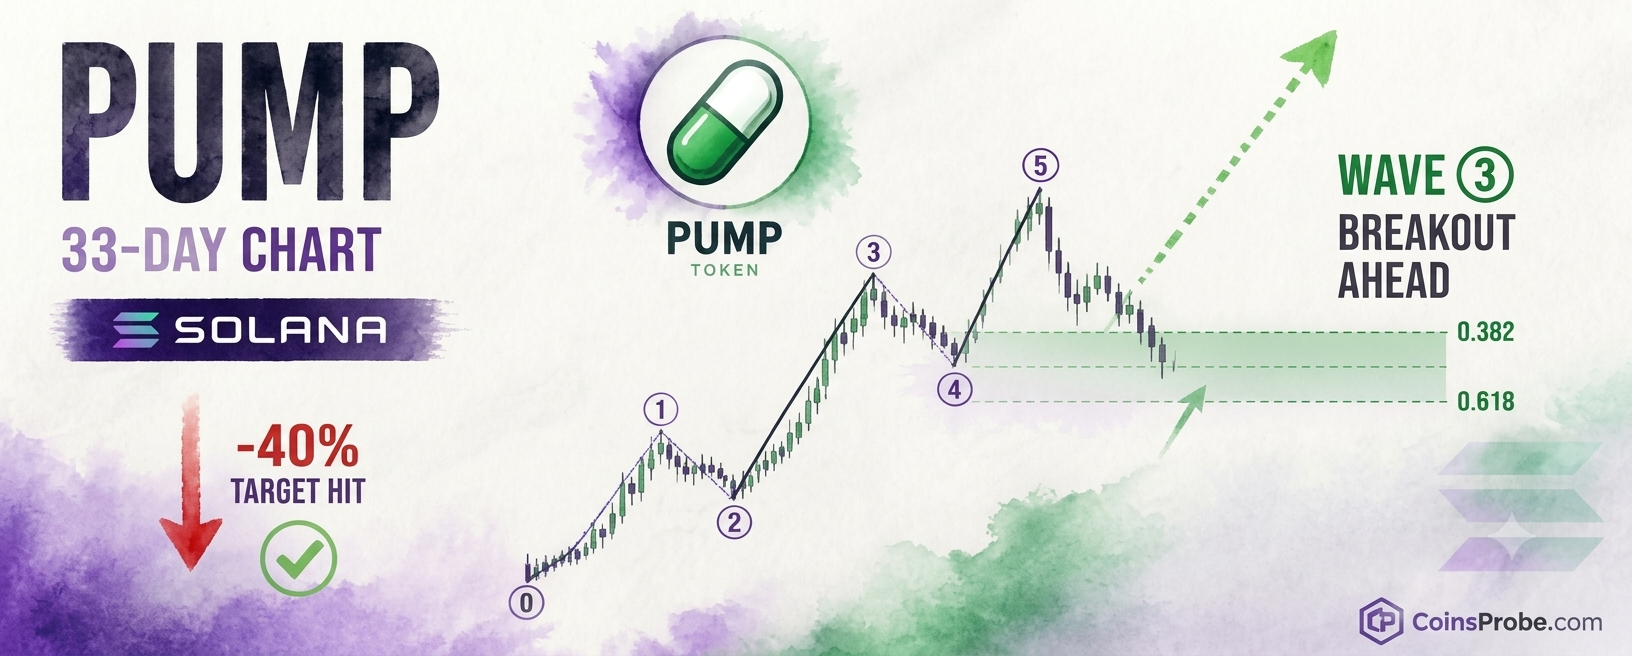
Key Highlights PUMP's corrective wave hit the $0.002270–$0.003460 buy zone exactly — confirming an analyst's October -40% drop call One analyst flagged this target zone on Oct 14, 2026 using
Key Highlights
PUMP's corrective wave hit the $0.002270–$0.003460 buy zone exactly — confirming an analyst's October -40% drop call
One analyst flagged this target zone on Oct 14, 2026 using a 3-day Elliott Wave chart; price confirmed the zone on Nov 17, 2026
Pattern is still forming — wave 3 breakout requires a reclaim of the 0.382 Fibonacci level (~$0.003460) on the 3-day chart
PUMP has completed the corrective move an analyst flagged in October — a -40% drop that landed precisely inside the projected buy zone of $0.002270–$0.003460. The correction, called a full month before price arrived there, is now confirmed with a green checkmark on the 3-day chart. The question shifts from “when does it fall” to “when does it launch.”
In a November 17, 2026 update, one crypto analyst (@CryptoBullet1) confirmed the thesis with characteristic confidence: “In October I was so ‘bullish’ that called for a -40% drop on $PUMP. Guess what? Target Zone perfectly reached.” The post referenced a prior October 14, 2026 thread in which the analyst identified a completed 1–5 Elliott Wave impulse on PUMP’s 3-day chart and explicitly marked the corrective buy zone before the decline began. For background on that original call, see PUMP Prints 1–5 Elliott Wave Impulse — Analyst Eyes $0.002270–$0.003460 Buy Zone.
Elliott Wave theory counts market moves in structured sequences. A five-wave impulse (labeled waves 1 through 5) represents a primary trend. After the impulse completes, a corrective phase retraces a portion of that move before the next major directional leg — labeled wave 3 in a higher-degree count — resumes.
On the 3-day PUMP chart, the analyst identified a completed 1–5 impulse up, followed by a curved corrective pullback. The correction has now reached the Fibonacci retracement zone spanning the 0.382 and 0.618 levels, with price sitting at the 0.5 midpoint of that range — confirmed by the analyst’s own checkmark annotation. Price is currently below the 0.382 retracement level and above the 0.618 level, placing it squarely inside the support box. The projected wave 3 move — a large impulse upward — has not yet begun. The pattern is still forming.

PUMP/USDT Analysis | Source: @CryptoBullet1 (X)
The specific buy zone identified in October — $0.002270 at the lower bound to $0.003460 at the upper bound — defined the entire Fibonacci target box. With price confirmed inside that range, the corrective wave 2 is treated as complete by the analyst’s framework. What follows, in Elliott Wave structure, is the extended third wave, historically the strongest and longest move in any five-wave sequence.
The significance of this update is not just the current setup. It is the accuracy of the prior call. On October 14, 2026, the analyst published a 3-day chart showing PUMP had printed a clear 1–5 impulse and outlined a corrective target zone of $0.002270–$0.003460 before the decline had reached those levels. That zone was derived from the standard 0.382–0.618 Fibonacci retracement of the prior impulse move.
Price then declined approximately 40% and reached that zone precisely. The November 17 update confirms the target was hit — not approximately, not close, but to the zone. This matters because the same analytical framework that correctly identified the correction now projects the upside continuation. The track record behind the current bullish call is not theoretical — it is documented in the same thread.
PUMP has also established itself as the absolute leader in Solana fees paid, a fundamental data point the analyst cited in the original October post. That on-chain positioning remains unchanged as the technical setup matures inside the buy zone.
The 3-day chart shows a dashed-line projected path targeting a wave 3 breakout above the corrective range. The pattern is still forming — the breakout has not yet occurred. The key transition point is a sustained move back above the 0.382 Fibonacci retracement level (chart label: approximately $0.003460), which would signal that the corrective phase is exhausted and the third-wave impulse is underway.
Until that level is reclaimed on the 3-day timeframe, price remains inside the buy zone — a zone of interest for accumulation according to the October framework, not yet a confirmed breakout. The RSI on the 3-day chart is reading in the 40–60 range, neither oversold nor overbought, leaving room for a directional move in either direction without immediate momentum exhaustion.
PUMP’s prior volatility is relevant context here. The asset saw significant liquidation events during the corrective phase — a separate event covered in PUMP Token Drop Triggers $3.61M Liquidation Across Two Traders — which is consistent with the type of leveraged flush that often accompanies a corrective wave bottom before a third-wave reversal.
Most trading setups are assessed after the fact. This one has a verifiable prior call with a documented zone, a documented percentage target, and a documented confirmation. The analyst called a -40% correction while framing it as a bullish setup. That is a specific, falsifiable prediction — and it proved correct.
The current setup is therefore not a fresh hypothesis. It is the continuation of a framework that already passed its first test. Wave ③, if it unfolds, is typically the largest and most powerful wave in an Elliott Wave sequence, often extending 1.618x to 2.618x the length of wave ①. No specific price target has been stated by the analyst in the November update — the framework is stated, the zone confirmation is stated, the direction is stated. Specific upside levels remain unquantified in the available source material.
What is clear: price is inside the buy zone, the corrective wave is treated as complete, and the analyst’s framework — which correctly called the -40% decline — now points upward.
Watch $0.003460 as the first structural level that, if reclaimed on the 3-day chart, would validate the transition from corrective wave 2 to impulsive wave 3.
Disclaimer: The views and analysis presented in this article are for informational purposes only and reflect the author’s perspective, not financial advice. Technical patterns and indicators discussed are subject to market volatility and may or may not yield the anticipated results. Investors are advised to exercise caution, conduct independent research, and make decisions aligned with their individual risk tolerance.
Also Read: Binance Altcoin Netflow: AI and DeFi Tokens Seeing Exchange Outflows