Can a coin up 72.99% in 24 hours keep climbing, or has the easy part already happened? From a $0.008281 low to a $0.01599 high, the token covered huge ground in a single day. The RARE price p
Can a coin up 72.99% in 24 hours keep climbing, or has the easy part already happened?
From a $0.008281 low to a $0.01599 high, the token covered huge ground in a single day. The RARE price prediction now depends on whether buyers can defend the new floor.
Readers who missed the earlier setup can open theprevious SuperRare 2026 forecast.
RARE Market Data Snapshot
CoinMarketCap RARE page lists the RARE price today at $0.01443, up 72.99% in 24 hours.
Market cap is $11.91M. Fully diluted value, which counts every token that will ever exist, is $14.43M.
Volume is the loud number.
Trading hit $108.9M, up 1764%, or 928.99% of market cap. Circulating supply is 825.41M of a 1B cap.
At 08:21 UTC on Nov 16, 2026, CoinGlass and the Binance chart showed $0.01376 and $0.01375.
Why RARE Is Moving Today
CoinGlass derivatives data shows futures volume at $284.23M. Spot managed $20.70M.
That's almost 14 times more futures action than spot buying.
Open interest, the total value of open futures contracts, jumped 382.14% to $12.52M, above the $11.67M market cap.
Funding tells the rest. The funding rate, a fee for long and short swaps to keep futures near spot, sits at negative 2.4008%.
Shorts are the ones paying.
Liquidations hit $1.19M, and 59% of that was shorts. Forced buybacks feed a short squeeze, and this has the shape of one.
RARE Technical Analysis on the Daily Chart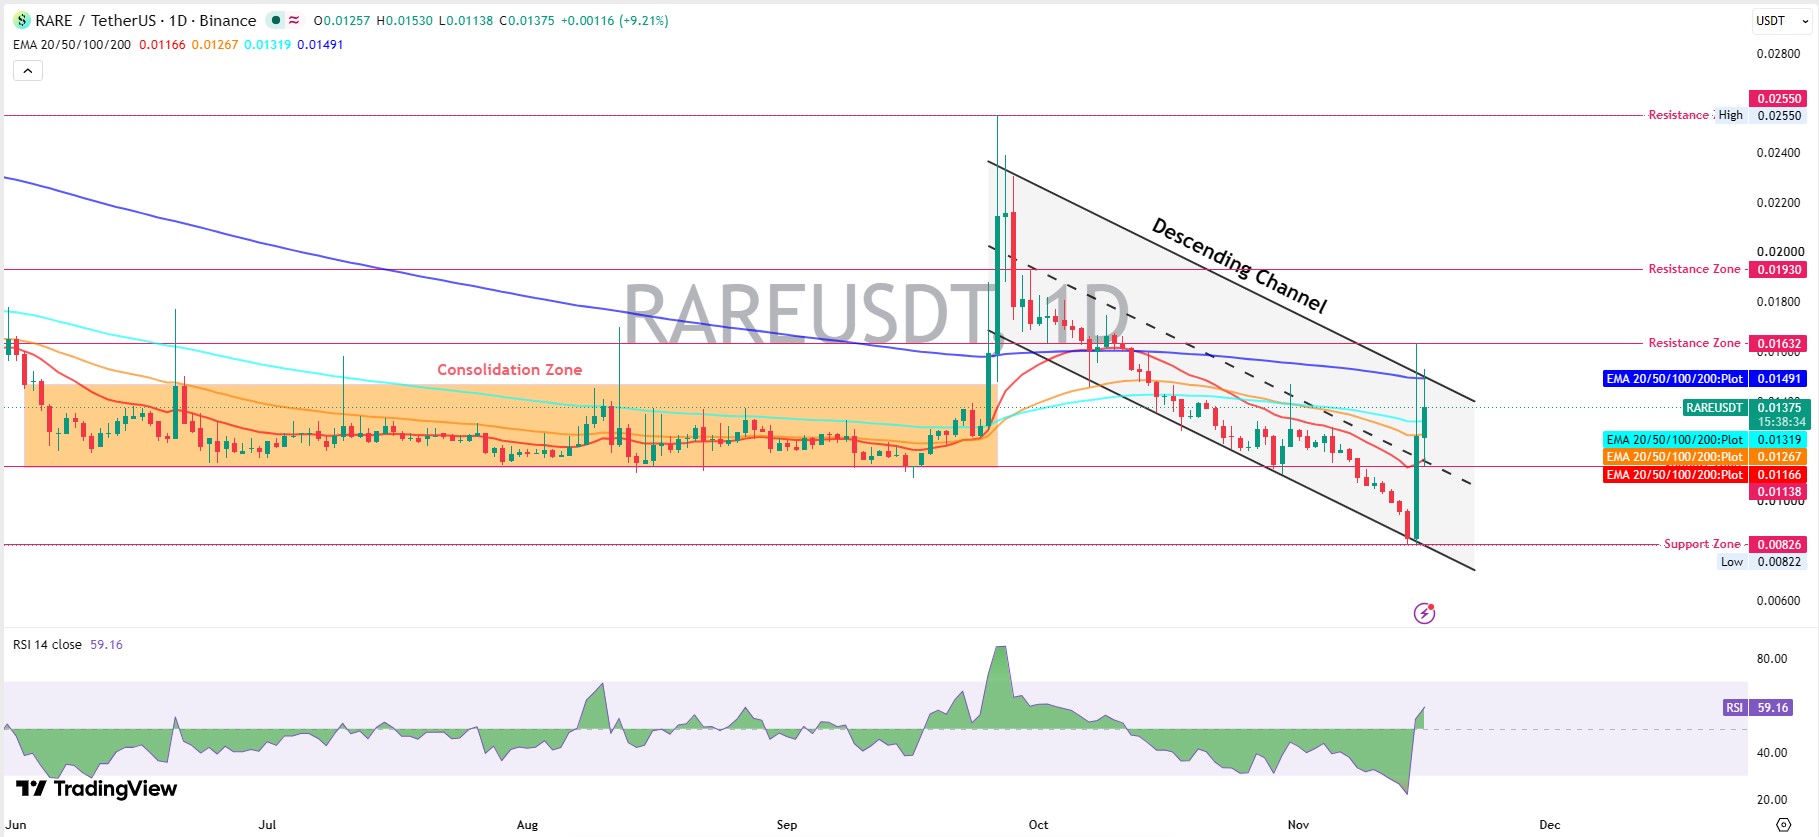
This RARE technical analysis starts with theTradingView daily chart of RARE/USDT on Binance, where June to mid-September shows a sideways range from about $0.0114 to $0.0146.
Late September broke it. A spike ran to $0.02550, and RSI, a 0 to 100 gauge of buying strength, shot above 80.
That spike didn't last. Price slid into a descending channel, a pair of sloping lines that trap price in a downtrend, and stayed inside it for roughly 7 weeks.
Price bottomed at $0.00822, just under the $0.00826 support zone, a level where buyers have stepped in before. RSI sank toward 20.
Then came the turn. In two sessions, the price jumped through the 20 EMA, an average of recent prices that weighs the latest days more, at $0.01166, and the 50 EMA at $0.01267.
It cleared the 100 EMA at $0.01319 too, and the RSI climbed to 59.16, short of the 70 line that marks overbought.
At 08:21 UTC, the daily candle that opened at $0.01257 had run to $0.01530 and was trading at $0.01375, up 9.21%.
But sellers are waiting at a single level. The 200 EMA at $0.01491, joined by the channel's upper line. Until buyers push a daily trade above it, this is a bounce inside a downtrend.
Who Holds RARE and Why It Matters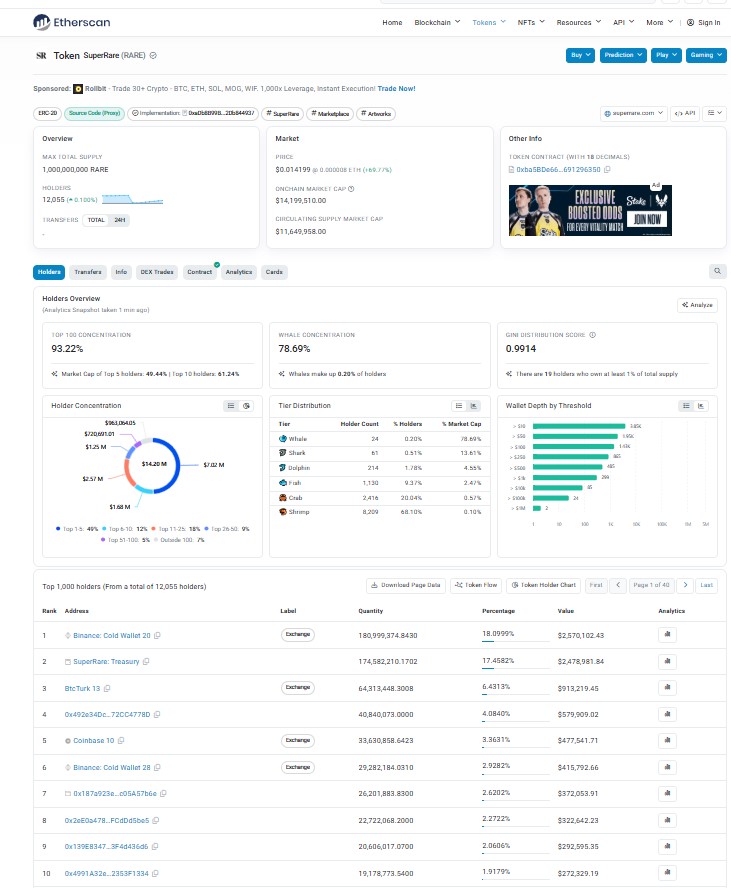
Etherscan holder data shows 12,055 holders and a Gini score of 0.9914, a 0 to 1 gauge of how unevenly tokens are spread.
Concentration is the problem. Extreme concentration.
The top 5 wallets hold 49.44%, and the top 10 hold 61.24%. Binance Cold Wallet 20 alone holds 18.0999%, worth $2.57M. And 24 whales hold 78.69% of market cap.
Exchange wallets hold customer coins, so they aren't automatic sellers. But a market cap near $12M moves on very few orders.
So what happens if a top wallet decides to sell?
RARE Support and Resistance Levels
RARE support and resistance zones sit tightly between $0.01138 and $0.01491. Support starts at $0.01319, the 100 EMA, with $0.01267 right under it.
A trade below $0.01166 puts the $0.01138 range floor in play. Under that, $0.00826 is the last real support.
Overhead, the first wall is obvious. $0.01491.
After that come $0.01632 and $0.01930, then the $0.02550 high. Setups for other coins sit inother crypto price predictions.
RARE Price Prediction Scenarios and Targets
Under this RARE price prediction, bulls keep the edge while price trades above the 100 EMA at $0.01319.
The RARE price projection hinges on $0.01491, since every target above it needs a daily push through that level first.
A fresh listing would change liquidity fast, solatest exchange listing updates matter here.
Scenario
Trigger
Target
Invalidation
Liquidity Condition
Bull
Daily trade over $0.01491
$0.01632, then $0.01930
Trade below $0.01319
Spot volume rises, shorts stay trapped
Base
Range between $0.01319 and $0.01491
$0.01319 to $0.01491
Trade above $0.01491 or below $0.01267
Futures cool, volume fades
Bear
Trade below $0.01267
$0.01166, then $0.01138
Reclaim of $0.01319
Open interest unwinds, spot demand thin
Risks Behind the RARE Price Outlook
The RARE price outlook turns weaker on a rejection at $0.01491, and the $0.01530 wick already showed sellers there.
Open interest above market cap means leverage runs this tape. A single wave of long liquidations ends it.
And the SuperRare treasury wallet holds 174.58M tokens. Any SuperRare price forecast has to price in a transfer from it.
Small caps share liquidity, somemecoin market news is worth a glance when futures cool.
Where RARE Goes Next
The final call on the RARE price prediction is bullish above $0.01319.
Buyers who hold daily trades above $0.01491 open the nearest RARE price target at $0.01632, with $0.01930 beyond it.
But a break under $0.01267 ends the bounce and puts $0.01138 back in play.
The 200 EMA is the test for this RARE price analysis. Traders chasing other themes can scanAI crypto news.
Disclaimer. This article is for information only and isn't financial advice. Crypto prices swing hard, and low-cap tokens like RARE can lose value fast. Traders should do their own research before making any decision. Market data comes from CoinMarketCap, CoinGlass, Etherscan, and TradingView at the times shown.