RBLK is up 50.65% over the past week to $0.00107, a genuinely large move by any measure. But this Rollblock listing date update is not built around that weekly gain, it's built around today's
RBLK is up 50.65% over the past week to $0.00107, a genuinely large move by any measure.
But this Rollblock listing date update is not built around that weekly gain, it's built around today's chart, which shows a sharp rejection from an intraday high near $0.00114 and a 1.26% pullback.
A 50% rally does not automatically mean a confirmed breakout, and this update maps out where buyers may now be trapped and which levels would actually confirm or invalidate a recovery.
RBLK Stats Snapshot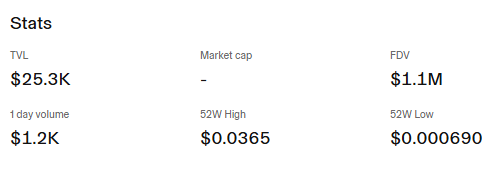
Source: RBLK live price dashboard, captured August 21, 2026
Metric
Value
Current Price
$0.00107
1-Week Change
+$0.00036 (50.65%)
1-Day Change
-$0.000014 (-1.26%)
TVL
$25.3K
Market Cap
Not available
FDV
$1.1M
1-Day-Volume
$1.2K
52-Week High
$0.0365
52-Week Low
$0.000690
The Weekly Move: From Flat to a 50% Rally
The 1W chart shows RBLK holding a largely flat, low-volatility range through most of last week before a sustained climb beginning around August 19 carried the price from roughly $0.0008 up toward an intraday high near $0.00114.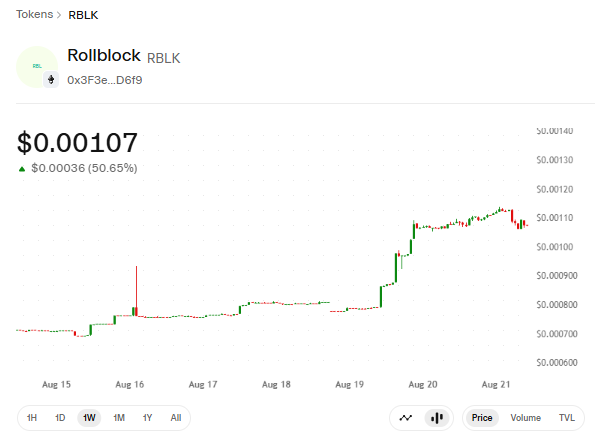
Source: RBLK live 1w price chart, captured August 21, 2026
That is the move behind the 50.65% weekly figure, a genuine multi-day climb rather than a single spike candle, which gives this rally more structural credibility than a one-session pump.
Today's Rejection: Where Trapped Buyers May Sit
The 1D chart tells the more immediate story. RBLK pushed up to an intraday high near $0.00114 this morning before a sharp red candle rejected that level, pulling price back down to the current $0.00107.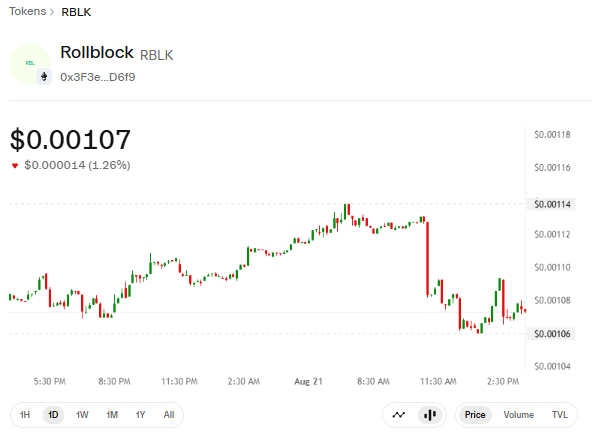
Source: RBLK live 1D price chart, captured August 21, 2026
Anyone who bought into that push toward 0.00112-0.00114 is now sitting on an unrealized loss unless the price reclaims that zone, and that group is exactly what a "trapped buyers" read on this chart refers to.
Their eventual behavior, selling into any bounce back toward breakeven, or holding through the pullback, is likely to shape RBLK's next move more than fresh buying interest will.
Is Falling Volume During the Pullback a Red Flag?
Today's $1.2K volume is notably lower than the $2.1K spike flagged in a previous update, even though price is still near its weekly highs.
Falling volume during a pullback cuts two ways: it suggests the rejection is not being driven by heavy panic selling, but it also means any recovery attempt from here would need to show renewed volume to be taken as genuine, rather than another thin-liquidity move in either direction.
Key Support and Resistance Levels
Level
Price
Significance
Resistance
$0.00114
Today's rejected intraday high is the level trapped buyers are waiting to reclaim
Current Zone
0.00106–0.00108
Where price is consolidating after the rejection
Support
0.00095–0.00100
Mid-week range before the sharpest leg of the rally
Deeper Support
$0.000690
52-week low
What Would Confirm or Invalidate This Rally?
Confirmation would look like RBLK reclaiming and holding above $0.00114 on rising-volume, which would also relieve pressure on buyers trapped near that level.
Invalidation would look like a break back below the 0.00100-0.00105 zone, which would suggest the weekly rally is fully unwinding rather than consolidating.
Could a Listing Catalyst Change This Setup?
No confirmed CEX listing exists for RBLK as of this update.
A genuine listing catalyst would be the kind of event that could resolve the current standoff, bringing enough fresh-volume to either absorb trapped-buyer selling or extend the rejection, depending on how the market reads the news.
Until that happens, this remains a thin-liquidity chart working through its own internal pressure.
Rollblock Price Prediction: Near-Term Scenarios
This RBLK price prediction uses the current $0.00107 price, the $0.00114 rejected high, and the 52-week range as its basis.
Scenario
Estimated Price Range
Key Driver
Invalidation
Bear Case
0.00090–0.00100
Rejection extends as trapped buyers capitulate; volume stays thin
A sustained close above $0.00107 would break this
Base Case
0.00102–0.00110
Price consolidates in the current range without a decisive move either way
A break of either boundary would end this range
Bull Case
0.00120–0.00145
Price reclaims $0.00114 with rising-volume, turning trapped buyers into support
Requires multi-day volume confirmation above today's $1.2K
Rollblock Price Prediction: Trapped-Buyer Resolution Scenarios
A second Rollblock price prediction table isolates how the trapped-buyer overhang near 0.00112-0.00114 could resolve.
Scenario
Estimated Outlook
Key Driver
Invalidation
Trapped Buyers Exit Into Bounces
Repeated selling caps rallies near 0.00110-0.00114
Buyers from the rejected zone sell to break even on any recovery attempt
Rising volume absorbing that selling without price falling would break this
Buyers Hold, Support Builds
A base forms near 0.00100-0.00107 for a fresh push higher
No forced capitulation; volume stabilizes rather than collapsing
A break below $0.00100 would contradict this
Listing Catalyst Absorbs the Overhang
Fresh demand outweighs trapped-buyer selling pressure
A confirmed CEX listing brings genuinely new volume into the chart
No listing confirmation currently exists to support this
Disclaimer
Informational purposes only, not financial advice. RBLK's market cap remains unavailable due to unreported circulating supply. Price prediction ranges above, across both tables, are pattern-based estimates derived from chart, volume, and 52-week range data, not confirmed technical levels or guaranteed outcomes. Cryptocurrency carries significant risk of loss.

