Looking for an RE price? You're not alone; this coin has everyone watching right now. $RE promised something big: real insurance money, brought on-chain for anyone to buy into. That story sen
Looking for an RE price? You're not alone; this coin has everyone watching right now.
$RE promised something big: real insurance money, brought on-chain for anyone to buy into. That story sent it soaring to an all-time high near $1.08, and early buyers were bragging about their gains.
Now things have flipped. RE just dropped over 30% in one week and is down more than 60% from its peak. Believers say this is just a shakeout before the next big move.
Doubters think the hype is fading. Which is why everyone wants an RE Price Prediction right now to find out who's right.
RE Price Prediction Market Overview
Metric
Value
Current Price
$0.4132
24h Range
$0.4017 - $0.4595
7 Day Change
-30.2%
Market Cap
$65.12M
Fully Diluted Valuation
$408.017M
24h Trading Volume
$58.267M
Circulating Supply
159.6M RE
Total Supply
1B $RE
Max Supply
1B $RE
All-Time High
$1.08 (Jun 20, 2026)
Source: Data from CoinGecko
RE price forecast: Why Is $RE Price Falling
Long traders have taken the bigger hit. Over the past 24 hours, longs lost $289.92K to liquidations, compared to just $52.66K on the short side. That gap shows buyers keep getting caught trying to call the bottom too early.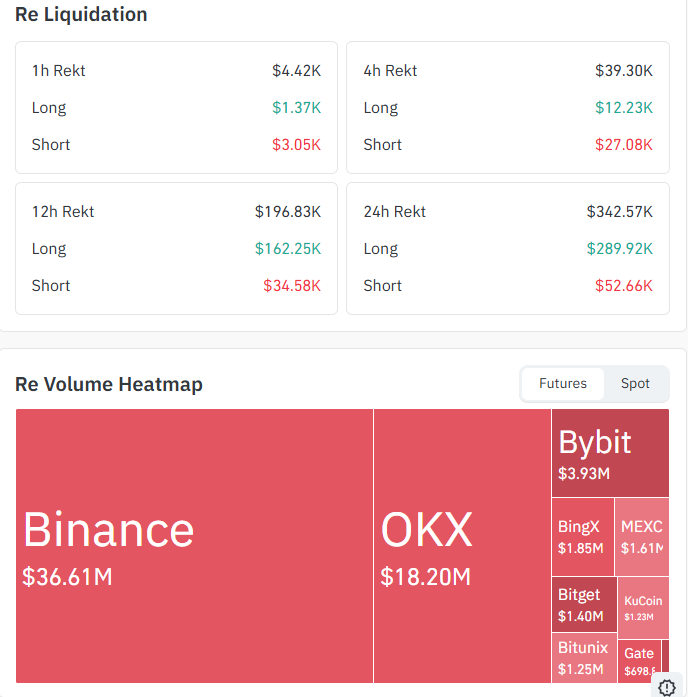
RE price prediction 2026: Short-Term Chart Analysis (4H)
$RE pumped hard when it first launched, but it never stayed above the $1.0500 level. Once that level failed, sellers took over.
From June 26 to July 8, the price held on to a rising trendline, moving up in a steady channel. That trendline broke on July 8, and $RE has been making a lower-low pattern.
Since that break, the drop has been steady rather than sharp. Price is now sitting right at a key support zone near $0.4145, the same level that has held so far.
The EMAs are stacked above price. with the 20 EMA near $0.4694 and the 50 EMA near $0.5157, both acting as resistance on any bounce.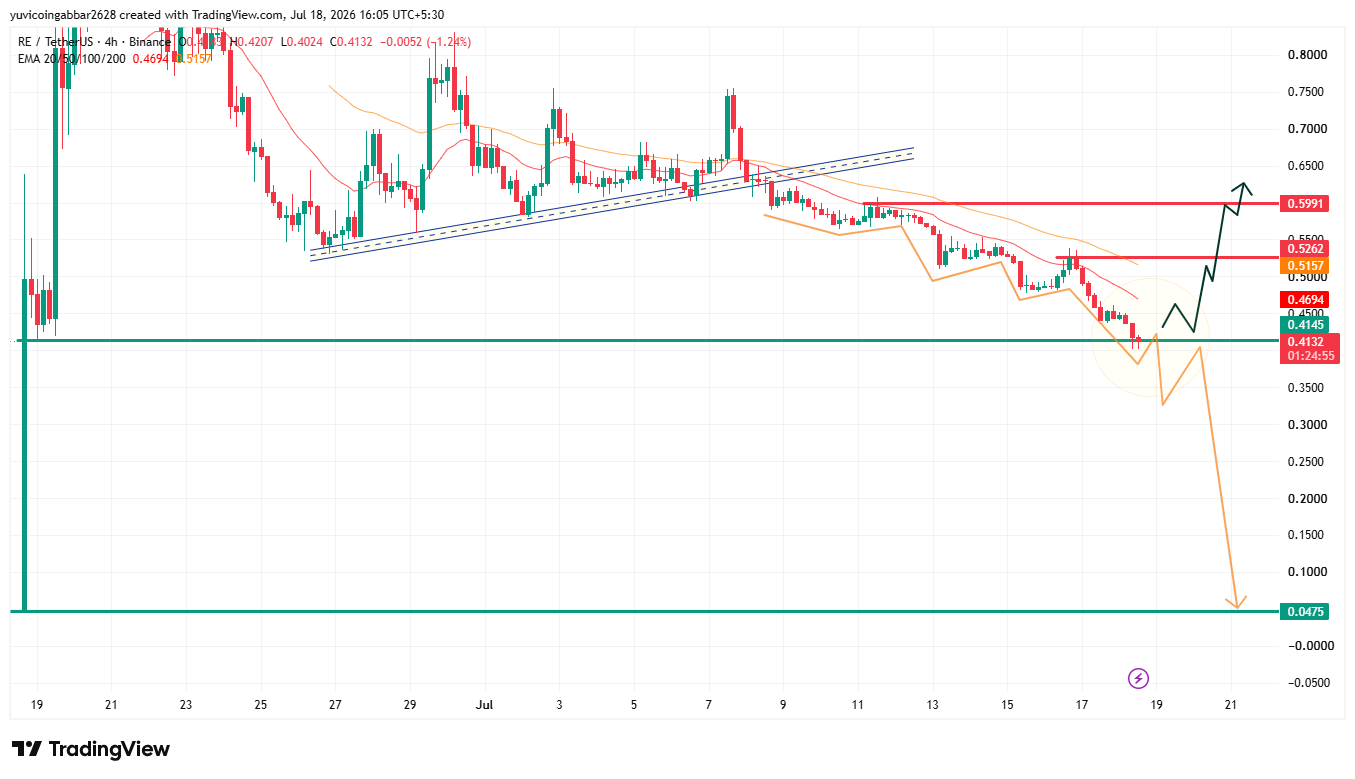
If $0.4145 breaks, the chart shows a much lower $RE support level near $0.0475, a zone that has not been tested since $RE started trading. That is a long way down, so a break would mark a real shift in structure, not just another leg of the pullback.
If price holds and bounces instead, the first $real hurdle is the 50 EMA zone near $0.5157 to $0.5262 (resistance), followed by resistance at $0.5991.
Level Type
Price
Resistance
$0.5991
Resistance
$0.5262
EMA Resistance (50)
$0.5157
EMA Resistance (20)
$0.4694
Support (critical)
$0.4145
Deep Support
$0.0475
Verdict: Holding $0.4145 keeps the door open for a bounce toward the EMA zone. A clean break below it puts the much lower $0.0475 level in play as the next real test.
Reinsurance Fundamentals: A Separate RE Price Prediction Angle
Away from the chart, $RE Protocol shared reinsurance industry data on July 16. According to the post, reinsurer return on equity is on track for a fourth straight strong year, with 21.9% in 2023, 16.4% in 2024, 18.9% in 2025, and 16.6% expected in 2026. 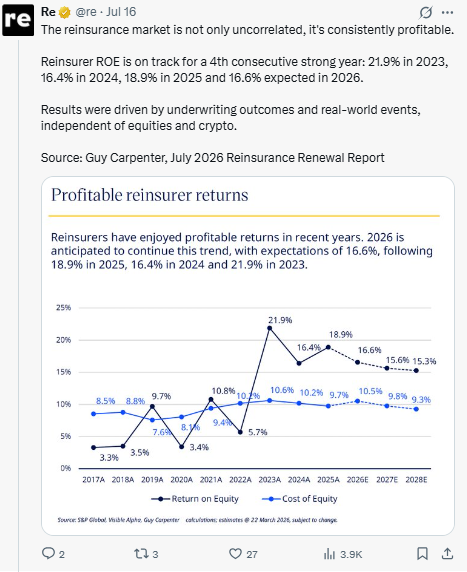
The numbers came from Guy Carpenter's July 2026 Reinsurance Renewal Report, and the post says results came from underwriting outcomes and real-world events rather than equities or crypto markets.
This is industry data about the reinsurance sector, not a promise about RE token price. Strong sector fundamentals do not guarantee any profit or ROI for $RE holders, and this section is shared for information purposes only, not financial advice.
Two-Reader Takeaway
For current RE holders, the level to watch is $0.4145. Losing that on a clean close would open the door to a much deeper drop.
For anyone thinking about buying in, it may be worth waiting to see if $0.4145 holds first, rather than stepping in during an active trendline breakdown.
RE Price Prediction Expert View
According to CoinGabbar analysts, the bull case needs $RE to hold $0.4145 and reclaim the EMA zone near $0.5157, which would suggest the sell-off is running out of steam.
The bear case is a clean break below $0.4145, which would open up the much deeper $0.0475 zone with little support in between.
With longs still taking the bigger hit on liquidations, the path of least resistance stays down until buyers show up in size. Checking live $RE price data is worth doing while this plays out.
Disclaimer: This article is for informational purposes only and does not constitute financial advice. Cryptocurrency markets are highly volatile, and all investment decisions carry risk.