Can RENDER reclaim the $2.188 level after the RNP-024 vote? This Render price prediction starts at $1.49, the CoinGecko price on Nov 3, 2026. RENDER trades under its 50-day EMA, the average o
Can RENDER reclaim the $2.188 level after the RNP-024 vote?
This Render price prediction starts at $1.49, the CoinGecko price on Nov 3, 2026. RENDER trades under its 50-day EMA, the average of the last 50 daily prices, and a governance vote is next. The latestRNP-024 vote coverage covers the proposal.
Render 24-Hour Market Snapshot
CoinGecko market data shows RENDER at $1.49, near the low of its 24-hour range. FDV, or fully diluted valuation, is the coin's value if the total supply were all in circulation.
Metric
Value
Price
$1.49
24h change
-5.03%
Market cap
$795.908M
FDV
$840.485M
24h trading volume
$25.529M
Circulating supply
533.536M RENDER
Max supply
644.169M RENDER
Source: CoinGecko market data, captured Nov 3, 2026, 06:00 UTC.
Circulating supply covers 82.8% of max supply.
Render RNP-024 Vote News and Price Catalyst
An RNP is a Render Network Proposal, the project's formal governance vote. Per theofficial Render Network X post, the final RNP-024 (Forth) vote opens Nov 3 at 5 PM PT. That's 01:00 UTC on Nov 4, 2026.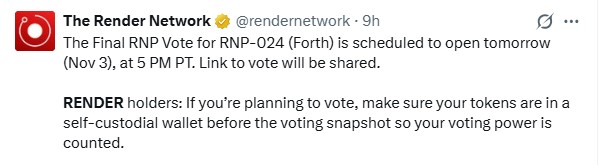
Source: official Render Network X account, captured Nov 3, 2026, 06:00 UTC.
The same post asks holders to keep tokens in a self-custodial wallet before the voting snapshot, a record of balances at a set time.
If the vote passes, buyers get a defined catalyst, but the price still has to reclaim $1.597. If it fails, the catalyst fades, and $1.375 stays the level to watch.
Coinglass price performance data shows RENDER down 12.86% over 7 days. That puts the price about $0.22 under the $1.71 level a week earlier.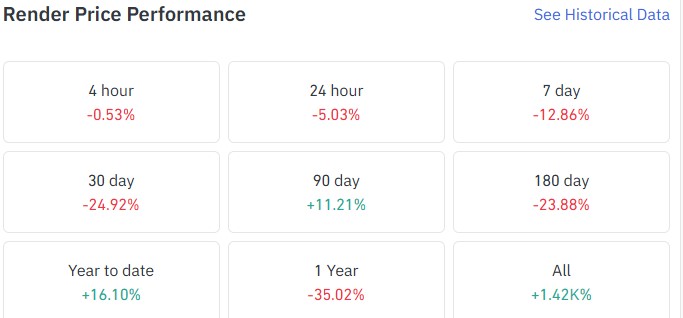
Source: Coinglass price performance data, captured Nov 3, 2026, 06:00 UTC.
The 24h change is -5.03%, matching the $1.57 top of the 24h range. The price sits $0.01 above the $1.48 low, in the bottom 11% of the day's range.
Over 30 days, the loss is 24.92%, or roughly $0.49 from $1.98. But the 90-day return is still +11.21%, so the pullback sits inside a longer gain.
Render Whale Wallets and Price Forecast Risk
Solscan holder data shows the top 10 wallets hold 47.79% of supply, or 232.42M tokens.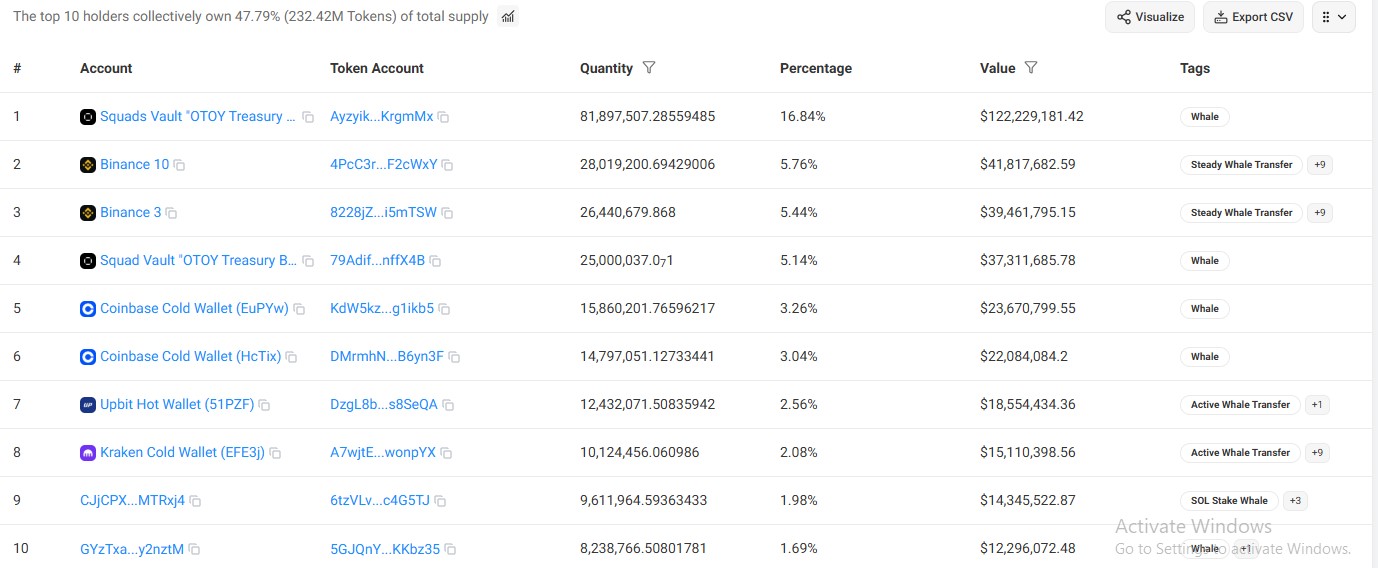
Source: Solscan holder data, captured Nov 3, 2026, 06:00 UTC.
The largest whale wallet is a Squads vault tagged OTOY Treasury, holding 16.84% of supply. Two Squads vault wallets together hold 21.98%.
Six exchange wallets from Binance, Coinbase, Upbit, and Kraken hold 22.14%. Exchange-held supply reaches the order book fastest.
Render Open Interest and Futures Volume
Open interest is the value of futures contracts still open and not yet settled. CoinGecko lists RENDER perps open interest at $68.962M.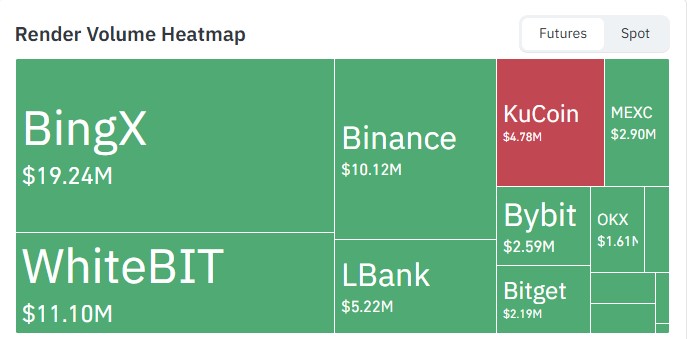
Source: Coinglass futures volume heatmap, captured Nov 3, 2026, 06:00 UTC.
TheCoinglass futures volume data ranks BingX first at $19.24M, ahead of WhiteBIT at $11.10M. The gap between the top two is $8.14M. Binance ranks third at $10.12M.
BingX's volume is 1.73 times WhiteBIT’s, so one venue leads the futures flow.
Render News Catalysts and Risks This Week
The dated catalyst is the RNP-024 vote, opening at 01:00 UTC on Nov 4, 2026, per the official X post.
Conditions to watch are a daily candle trading above $1.597 and RSI back above 40. Widercrypto news can add noise.
Render Technical Analysis: 50-Day EMA, RSI Level
In this Render price prediction, the Binance RENDER/USDT daily chart on TradingView tells the story in stages. The price traded near $1.40 in mid-September, then rallied toward the $2.188 resistance zone in early October.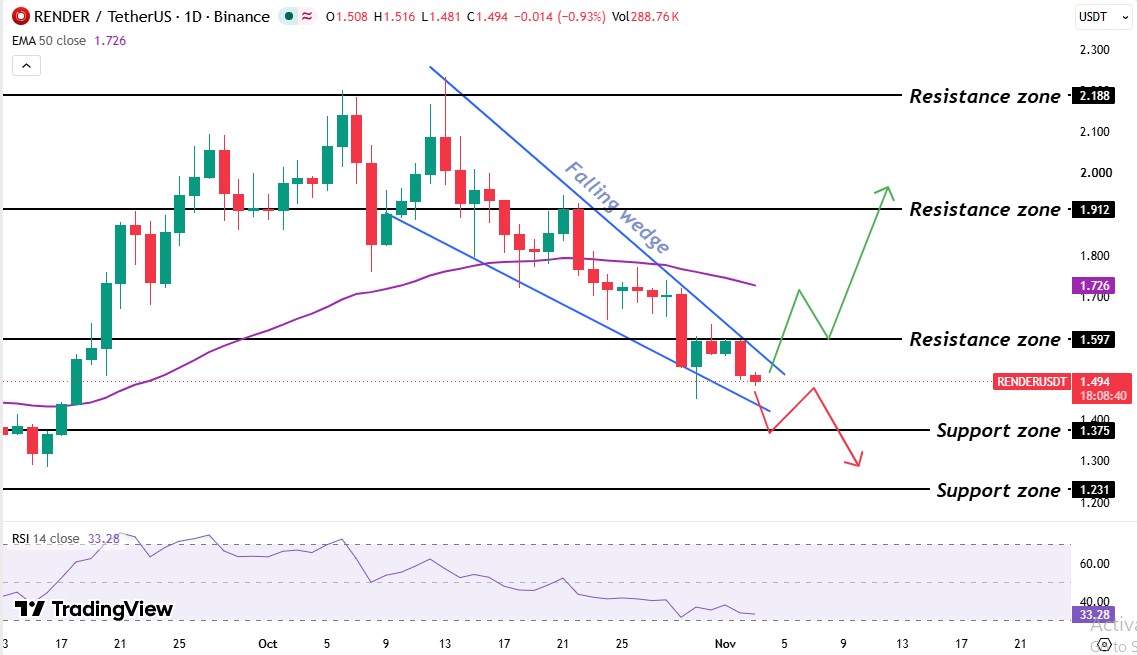
Source: TradingView, Binance RENDER/USDT 1D, captured Nov 3, 2026, 06:00 UTC.
But the price couldn't hold that level and made a wick, and after the price traded between the $2.188 level and the 50 EMA level, the price started going downward.
By making lower highs and lower lows and forming a falling wedge, two down-sloping trendlines that narrow over time. Price bounced from the lower trendline in late October. Rejected at $1.597.
Support at $1.375 seemed the obvious bounce zone, but the price hasn't broken the wedge trendline yet.
The 50-day EMA is a exponential moving average that weights recent prices more. It sits at the $1.726 level, 15.8% above price, so rallies toward it meet overhead selling.
RSI reads 33.28, just above the 30 line that flags oversold readings. Selling still leads, but it isn't stretched yet. A prior setup is in theearlier daily breakout analysis.
Render Support and Resistance Levels
Level
Type
$2.188
Resistance
$1.912
Resistance
$1.726
50-day EMA
$1.597
Resistance
$1.375
Support
$1.231
Support
Support levels are zones where buyers have stepped in before. Resistance levels are zones where sellers have capped rallies. The nearest are $1.597 above and $1.375 below.
Bull, Base, and Bear Scenarios for the Render Price Forecast
Scenario
Trigger
Target
Invalidation
Bull
Daily candle trades above $1.597
$1.726, then $1.912
Daily candle trades below $1.375
Base
Daily candle trades between $1.375 and $1.597
Range holds
Daily candle trades outside the range
Bear
Daily candle trades below $1.375
$1.231
Daily candle trades back above $1.375
The bull path needs a wedge breakout. A delayed or defeated vote removes the catalyst, and a daily candle trading below $1.375 invalidates the bounce case.
Render Price Prediction: Expert View
As per CoinGabbar analysis, the stance for the week is cautious bearish. Price sits 15.8% under the 50-day EMA, and RSI at 33.28 shows no reversal. The falling wedge keeps an upside break open, but only after a daily candle trades above $1.597.
This Render price prediction shifts toward neutral if that candle arrives with rising volume, because it puts the 50-day EMA in play.
Disclaimer: Crypto markets are volatile, and RENDER can move sharply within hours. This Render price prediction is an analysis, not financial advice. Risk only what's affordable to lose.