A RHEA price prediction matters more this week than most. $RHEA jumped hard, and traders checking thecrypto price prediction hub want one answer: more room, or a snap-back? Turns out, the cha
A RHEA price prediction matters more this week than most. $RHEA jumped hard, and traders checking thecrypto price prediction hub want one answer: more room, or a snap-back?
Turns out, the chart gives clues either way.
$RHEA trades near $0.0523, sharply higher than last week.
Quick Prediction Box
Metric
Current Snapshot
$RHEA Price
$0.0523
24H Change
+65.9%
Market Cap
$21.47M
24H Volume
$7.21M
Trend
Bullish, overbought short term
RSI
82.30
Immediate Support
$0.048-$0.052
Immediate Resistance
$0.062
Next Target
$0.093 (conditional)
Bull Case
$0.075-$0.115
Base Case
$0.045-$0.065
Bear Case
$0.025-$0.038
Analysis timestamp: September 22, 2026, 00:00 UTC. Data status: live, post-breakout. Method: technical analysis, market structure, and market-cap scenario modeling.
RHEA Price Prediction: Current Market Snapshot
Circulating supply sits near 405.88M RHEA against a fixed max of 1B.
RHEA remains about 54.8% below its all-time high of $0.1133, set August 2, 2025, per CoinGecko data.
Seven-day range: $0.01419 to $0.05989. That spread alone tells a volatility story.
$RHEA Technical Analysis: Trend, RSI, and Momentum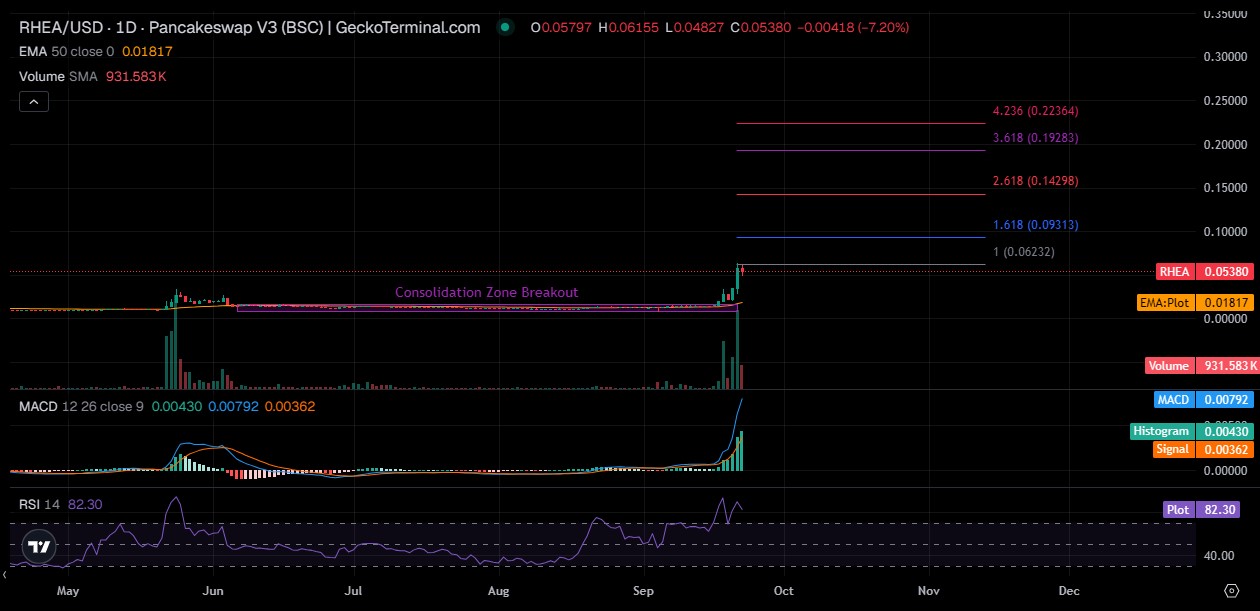
$RHEA Trend Analysis
The trend turned sharply bullish after a long consolidation. Price cleared a multi-month base as trading volume expanded fast.
The 50-period EMA sits near $0.0182, far below current trading levels. That gap usually narrows eventually.
But for now, structure favors buyers.
$RHEA RSI and Momentum
RSI reads 82.30 on the daily chart. Deep overbought territory.
No real divergence shows yet between price and RSI, meaning the move hasn't lost steam internally.
Still, overbought doesn't mean an instant reversal. It means risk rises.
RHEA Volume Analysis
RHEA's breakout came with a genuine volume spike, not a thin wick on low liquidity.
MACD sits at 0.00792 against a signal line of 0.00362, with a rising histogram. That's confirmation, not just hope. Full chart detail sits on GeckoTerminal.
RHEA Support and Resistance Levels
Key $RHEA Support Zones
Immediate support sits at $0.048-$0.052, the old breakout shelf. Deeper support lands near $0.038-$0.042, the prior consolidation zone.
A third, harder floor sits near the 50 EMA around $0.018.
Key $RHEA Resistance Zones
First resistance sits at $0.062, the 1.0 Fibonacci extension. Above that, $0.093 marks the 1.618 extension.
Further out, $0.113 to $0.143 covers the old all-time high and the 2.618 extension.
What Confirms a Breakout?
A single wick above resistance means little. Confirmation needs a trading finish above the level, backed by above-average volume.
Anything less is just a poke.
$RHEA Price Prediction for the Next 24 Hours
Short-term range:$0.048 to $0.062. Momentum stays strong, but RSI near 82 raises pullback odds.
Bull trigger: a trading finish above $0.062 on rising volume. Bear trigger: a break under $0.048.
$RHEA Price Prediction for the Next 3-7 Days
If resistance breaks with real volume, $0.093 becomes the next stop. And if the price simply consolidates, expect a chop between $0.045 and $0.062.
If support fails instead, a retest of $0.038 looks likely.
All three outcomes stay technically valid right now.
$RHEA Price Prediction 2026
Scenario
Price Range
Main Driver
Invalidation
Bear
$0.025-$0.038
Support failure, risk-off
Recovery above $0.048
Base
$0.045-$0.065
Range-bound consolidation
Sustained break either side
Bull
$0.075-$0.115
Breakout continuation, volume
Drop back under $0.062
These ranges tie to circulating supply near 410M RHEA, not guesswork.
RHEA Price Prediction 2027-2030
Circulating supply is set to climb as vesting unlocks continue over thirty months, changing what market cap is needed to hold any given price.
Year
Est. Circulating Supply
Bear (Cap / Price)
Base (Cap / Price)
Bull (Cap / Price)
2027
~550M
$15M / $0.027
$45M / $0.082
$110M / $0.200
2028
~700M
$20M / $0.029
$70M / $0.100
$170M / $0.243
2029
~850M
$28M / $0.033
$100M / $0.118
$260M / $0.306
2030
~1,000M
$35M / $0.035
$150M / $0.150
$380M / $0.380
Target market cap divided by circulating supply gives implied price, a sturdier method than a random forecast number.
$RHEA Bull, Base and Bear Scenarios
Bull Case
Resistance breaks with volume expansion. Ecosystem activity keeps rising, and the wider crypto market stays supportive.
Base Case
Price consolidates. Ecosystem growth continues at a moderate pace while broader conditions stay mixed.
Bear Case
Major support gives way. Volume dries up as a BTC-led risk-off move drains liquidity.
What Would Invalidate Each Scenario?
A trading finish back above $0.062 kills the bear case fast. A drop under $0.038 kills the bull case just as fast.
The base case dies once either extreme confirms with volume.
$RHEA Fundamentals and Tokenomics
$RHEA Token Utility
$RHEA functions as the ecosystem's core utility and governance asset, perofficial tokenomics documentation. Roles span staking, liquidity, and value accrual.
xRHEA, a non-transferable staked form, boosts yield and works as collateral. oRHEA acts as a reputation-weighted incentive token, convertible into $RHEA.
$RHEA Supply and Allocation
Total fixed supply caps at 1B tokens. Team allocations carry a six-month cliff, then thirty months of linear vesting, with zero unlocked at launch.
That limits early insider selling, though it won't remove future supply pressure entirely.
Roughly 40% of total supply, near 157M RHEA, stays staked, with a thirty-day unstaking cooldown.
$RHEA Catalysts and Risks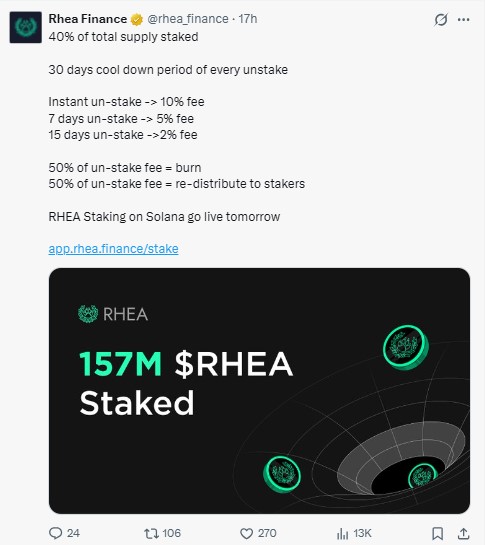
Potential Catalysts
Ecosystem growth keeps expanding, including on-demand lending for NEAR Intents solvers,confirmed via Rhea Finance. Staking demand and new integrations add fuel.
A first token burn already removed 150,000 RHEA from supply. Small, but directionally deflationary.
Key Risks
High volatility stays the obvious one. Thin liquidity in parts of the market can worsen slippage fast.
One risk already played out. Kraken scheduled $RHEA for delisting, disabling trading May 29, 2026, UTC, with balances liquidated by early September 2026, UTC. Reducedexchange listing access can dent liquidity too.
Supply expansion from ongoing vesting stays a slow-burn risk.
What Could Move $RHEA Price Next
Factor
Bullish Effect
Bearish Effect
Volume
Confirms breakout moves
Weakens breakout credibility
BTC
Risk-on environment
Broad sell-off
Liquidity
Better price discovery
Larger slippage
Ecosystem usage
Supports real demand
Weak adoption
Supply
Lower selling pressure
Higher selling pressure
Exchange access
More liquidity
Delisting, reduced access
$RHEA Trader Takeaway
Three levels matter more than any single price target. Fresh updates land on the crypto news feed.
Breakout confirmation above $0.062. First support at $0.048. And scenario invalidation if either extreme breaks with volume.
Is this move sustainable, or is it a fast fade waiting to happen?
Disclaimer
This article is for informational purposes only and does not constitute financial advice. Cryptocurrency markets carry high volatility and risk; independent research and professional consultation remain essential before any investment decision.