RIF price prediction searches picked up fast this week after a token tied directly to Bitcoin's own security budget posted a near-40% daily move, and that's not the kind of thing that happens
RIF price prediction searches picked up fast this week after a token tied directly to Bitcoin's own security budget posted a near-40% daily move, and that's not the kind of thing that happens to a "Bitcoin sidechain coin" every day. The timing lines up with something bigger than one chart: public companies just pushed their combined Bitcoin holdings past 1.28 million BTC, and Rootstock's own network stats are getting amplified right alongside it. That's part of a broader crypto market rally that's lifted sentiment across the board this week. So is this a genuine re-rating of a Bitcoin DeFi token or a bounce inside a much deeper downtrend? Let's look at what the data actually shows.
Why RIF Is Back On Traders' Radar
RIF, the token behind the Rootstock Infrastructure Framework (RIFOS), jumped nearly 39% in 24 hours while the rest of the market watched a very different story unfold: Bitcoin's institutional adoption numbers are hitting a fresh milestone, a theme that also shows up in the latestBitcoin price forecast coverage. Rootstock is a Bitcoin-secured smart contract layer, and that connection matters more than usual right now.
This isn't a low-float listing pump. RIF's entire 1 billion token supply is already circulating; there's no dilution overhang waiting in the wings. That changes the risk profile compared to tokens still working through vesting schedules.
But it also comes with its own baggage: liquidity is thin, the weekly chart is still deeply negative on the month, and the current price sits a long way below the token's all-time high.
Here's what the numbers say.
Token Contract
Full holder and transaction history for theRIF token contract is publicly viewable on Etherscan.
Key Takeaways
RIF trades near $0.1131 as of July 24, 2026, up roughly 38.88% in 24 hours, even though the weekly candle is still down about 10.5%.
Immediate resistance sits at $0.14939 (with the 4h chart's recent high at $0.14417), and a bigger wall waits at $0.18919.
Nearest 4h support is $0.07931, backed by a deeper zone near $0.04210–$0.04381.
Weekly RSI reads 61.93; 4-hour RSI reads 57.89. Neither is stretched, which leaves room to run before this move looks exhausted on either timeframe.
Total supply, max supply, and circulating supply are all 1 billion RIF; there's no future unlock cliff hanging over the price.
24-hour liquidations hit $3.96M, with shorts taking the bigger hit at $2.45M against $1.51M in longs.
Liquidity relative to market cap sits at just 0.02%, thinner than many small-cap tokens.
Analysis timestamp: July 24, 2026, 04:00 UTC. Chart data sourced from TradingView (Binance perpetual feed), CoinMarketCap, and on-chain holder analytics. Reviewed under a standard technical-analysis methodology using EMA, RSI, and horizontal support/resistance zones on 4h and 1W timeframes.
RIF Price Prediction: Where RIF Stands Right Now
RIF last traded around $0.1131 onCoinMarketCap's RIF listing and $0.11223 on the Binance perpetual feed, up roughly 38.88% over the past 24 hours. The 24-hour range ran from a low of $0.0782 to a high of $0.13.
Volume over that same window came in at $43.35M, which is 38.23% of the current $113.18M market cap and is itself up 124.88% day over day. That's a big jump in turnover for a token this size.
Unlike a lot of small caps, RIF doesn't carry a dilution gap: total supply, max supply, and circulating supply are all listed at 1 billion RIF, so the fully diluted valuation matches the market cap almost exactly at $113.18M. There's no future token-unlock cliff to price in here, a contrast worth keeping in mind next to the vesting pressure discussed in someEthereum price forecast coverage of network token supply.
The all-time high, $0.4591, was set on April 13, 2021, five years ago. The current price sits about 75% below that peak. This is not a token near its highs. It's a token bouncing hard inside a multi-year drawdown.
On the low end, the all-time low of $0.02736 was set March 13, 2020. The current price sits roughly 316% above that floor.
Coin overview data (market cap, FDV, supply, volume, all-time high/low) sourced from CoinMarketCap; snapshot taken July 24, 2026.
What's Driving RIF's Price Today
There's no single listing announcement driving this one. Instead, two threads appear to be feeding the same trade.
First,Rootstock's official network update has been actively promoting network milestones: more than 3,100 days of uninterrupted operations, close to 21 million transactions processed, over 40% share of total Bitcoin DeFi TVL, and 100% uptime since January 2018. The network also highlights zero security breaches and zero funds lost through its PowPeg bridging mechanism, with rBTC backed 1:1 by BTC and secured by more than 84% of Bitcoin's total hashrate.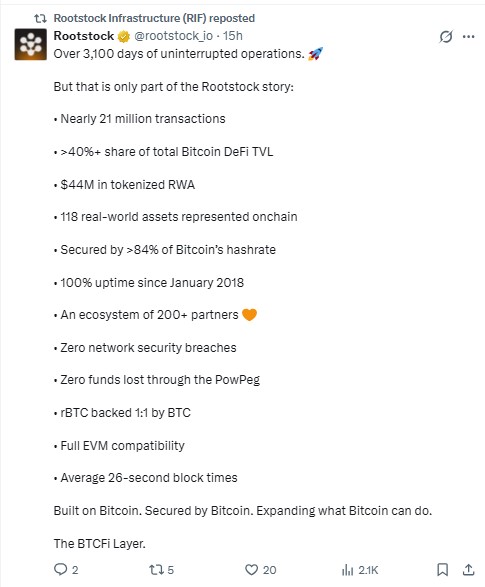
Second, and probably the bigger tailwind, Bitcoin's institutional adoption story just hit a new headline number, echoing the momentum tracked in recentBitcoin ETF inflow trends. Public companies now hold 1.28 million BTC combined, about 6.11% of Bitcoin's fixed 21 million supply, after adding 130,467 BTC in Q2 2026 alone, an 11.3% quarter-over-quarter increase. That treasury data now spans 184 publicly listed companies, though ownership remains heavily concentrated: one company alone, tied toMichael Saylor's Bitcoin strategy, holds roughly two-thirds of the public-company total.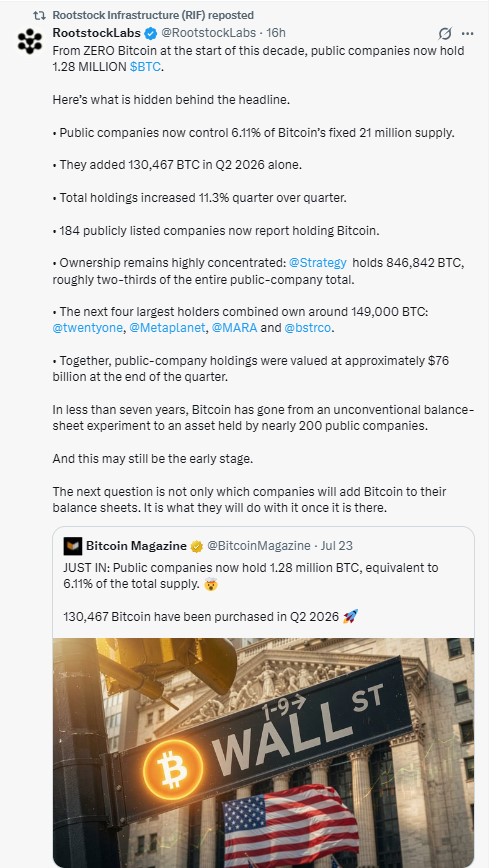
Put those two threads together, and it's not hard to see why traders rotated into a token that's explicitly a Bitcoin-secured smart contract layer. Whether that sentiment holds once the liquidation dust settles is a separate question, and the technicals below suggest some caution is warranted.
Technical Analysis: 4-Hour Chart
On the4-hour RIF/USDT perpetual chart, price broke down out of a long consolidation zone around July 20-21, dropped sharply into a V-shaped bottom near $0.04381, and has since ripped back up through the EMA.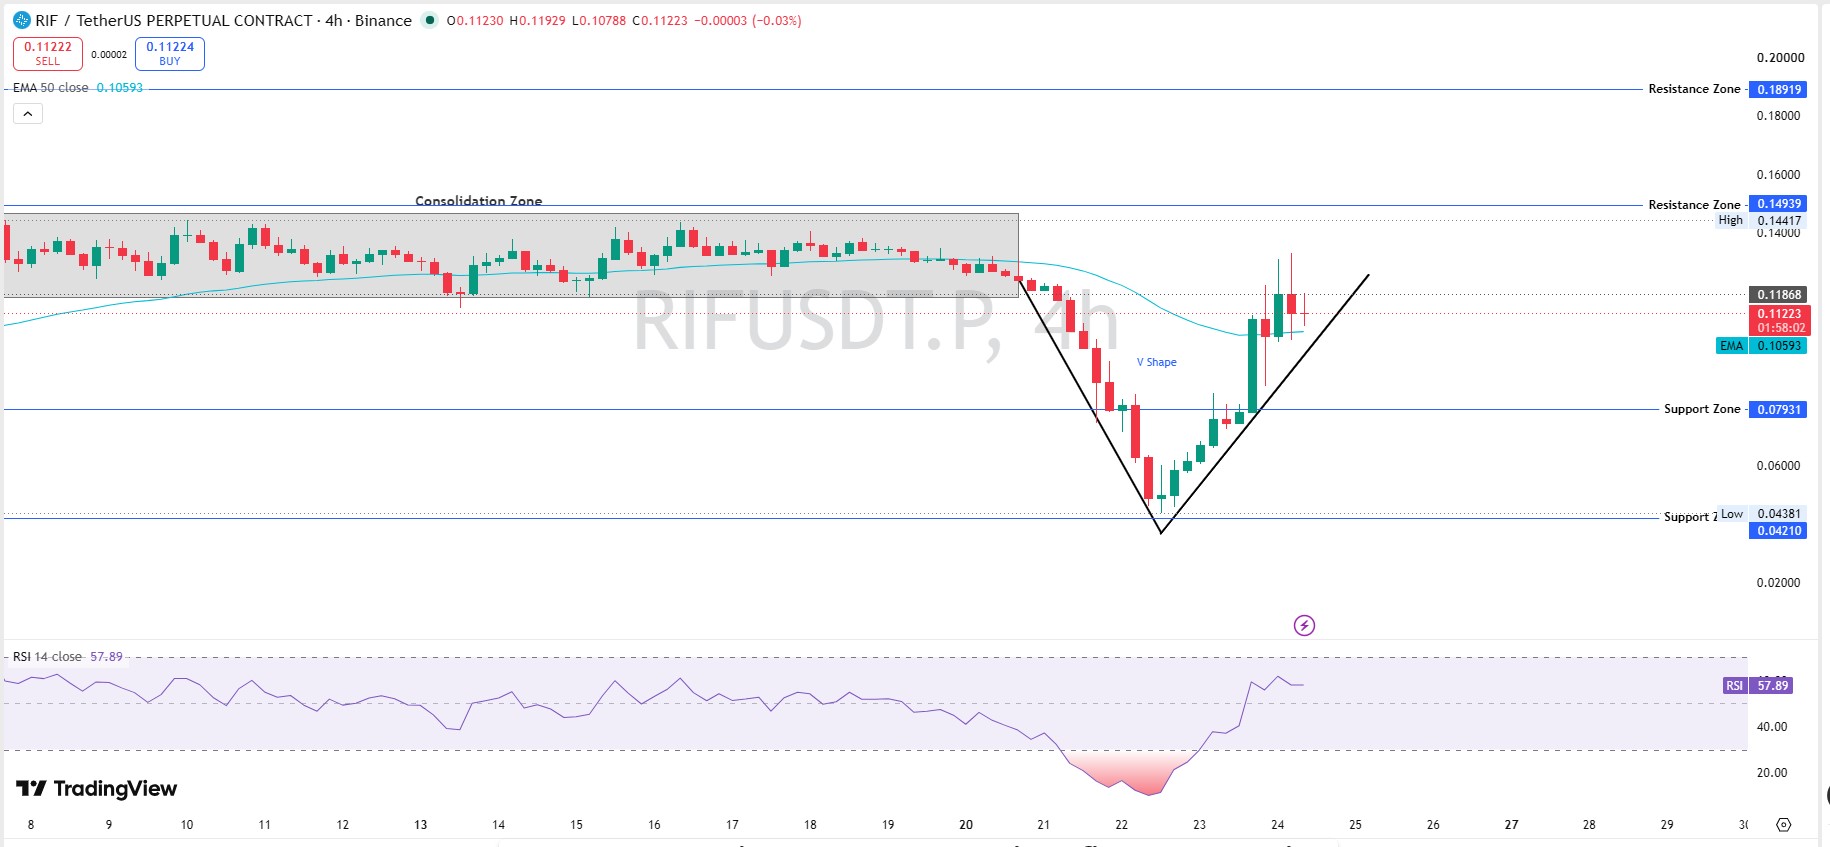
The 50-period EMA sits at $0.10593, just below the current price, a mildly bullish signal after the reclaim.
RSI on the 4-hour chart reads 57.89. That's well off overbought territory, and notably, it was sitting near 20 (deeply oversold) just before this bounce started. There's meaningful room left before this timeframe looks stretched, a setup somewhat similar to the pattern flagged in a recentXRP resistance test after a sharp rejection and recovery.
Immediate resistance sits at $0.14939, with the recent high inside that zone at $0.14417. A clean close through that level opens the door toward $0.18919, the next marked resistance zone.
Support underneath sits at $0.07931, the top of the old consolidation range, with a deeper floor at $0.04210–$0.04381, the exact low the V-shaped bottom was built on.
That V-shape matters. A sharp flush followed by an equally sharp recovery, on top of the liquidation data below, points to a squeeze dynamic rather than a slow accumulation.
Support and Resistance Snapshot (4H)
Level TypePriceResistance 2$0.18919Resistance 1$0.14939 (high $0.14417)Current Price$0.11223Support 1$0.07931Support 2$0.04210 (low $0.04381)
Technical Analysis: Weekly Chart
Zoom out to theweekly RIF chart data, and the tone shifts. This week's candle opened at $0.12638 and, despite today's bounce, is still closing near $0.11311, down about 10.5% for the week.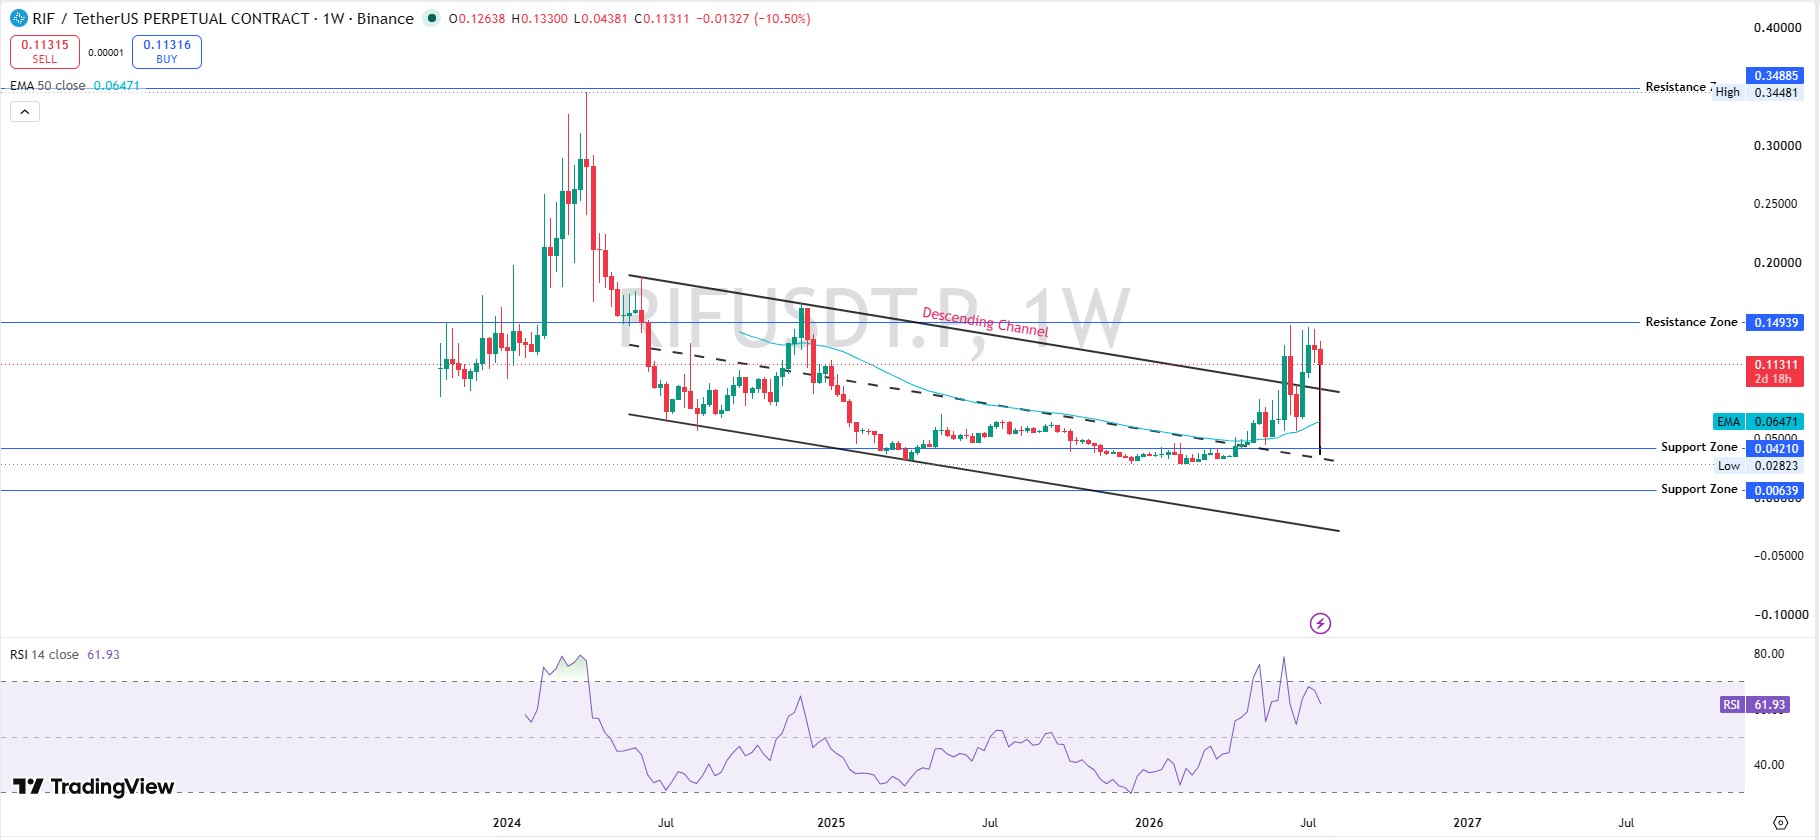
Price has spent the last several months inside a descending channel, with the current bounce testing the upper boundary of that channel and the $0.14939 resistance zone at the same time. That's a meaningful confluence: reclaiming this zone on a weekly close would be a real structural shift, not just a bounce, similar to how a firm reclaim was treated in a recent Bitcoin bull-bear outlook as a genuine trend signal rather than noise.
Weekly RSI reads 61.93. That's healthy, not overbought, again giving this move room to extend if buyers keep showing up.
The weekly EMA(50) sits at $0.06471, well below the current price, another sign the medium-term trend has already turned upward from the lows even if the broader multi-year structure remains a downtrend.
Above current price, the next major resistance sits at $0.34481–$0.34885, the prior high. Below, support sits at $0.04210, backed by a deeper zone near $0.00639 should the descending channel reassert itself.
The honest read: This is a strong bounce testing a real technical ceiling. Clearing it convincingly on a weekly close would change the conversation. Failing at it would put this right back in "dead cat bounce inside a downtrend" territory.
Support and Resistance Snapshot (Weekly)
Level TypePriceResistance 2$0.34481–$0.34885Resistance 1$0.14939Current Price$0.11311Support 1$0.04210 (low $0.02823)Support 2$0.00639
The Short Squeeze, In Real Time
Liquidation data tells a consistent story across every timeframe checked. In the last hour, $66.84K in positions were liquidated, with shorts taking $49.54K of that against $17.30K in long positions.
Over 4 hours, total liquidations reached $554.32K, split $234.55K short versus $319.77K long. Zoom out to 12 hours, and the pattern flips back toward shorts: $2.28M total, $1.27M short versus $1.01M long. Over 24 hours, $3.96M was liquidated in total, with shorts again taking the bigger hit at $2.45M against $1.51M for longs, a scale of forced selling not far off what was seen during themarket-wide liquidation event tied to the Iran ceasefire news earlier this year.
Shorts getting caught leaning the wrong way, twice, at both the 12h and 24h windows lines up with the V-shaped recovery on the 4-hour chart. Traders bet against the bounce, the price kept climbing, and forced buybacks added fuel on top of organic buying.
Squeezes like this tend to fade once short interest clears out. When they do, momentum often cools quickly, so the next few candles matter for confirming whether this move has organic legs.
Liquidation Snapshot
WindowTotalLongShort1h$66.84K$17.30K$49.54K4h$554.32K$319.77K$234.55K12h$2.28M$1.01M$1.27M24h$3.96M$1.51M$2.45M
Tokenomics and Holder Concentration
RIF's contract, 0x01b603be3D545F096015741e6503440282BF45fb, is an ERC-20 token, currently rated 3.5 out of 5 by CertiK. Total, max, and circulating supply all sit at 1 billion RIF, meaning the entire supply is already in circulation with no scheduled future unlocks left to dilute holders.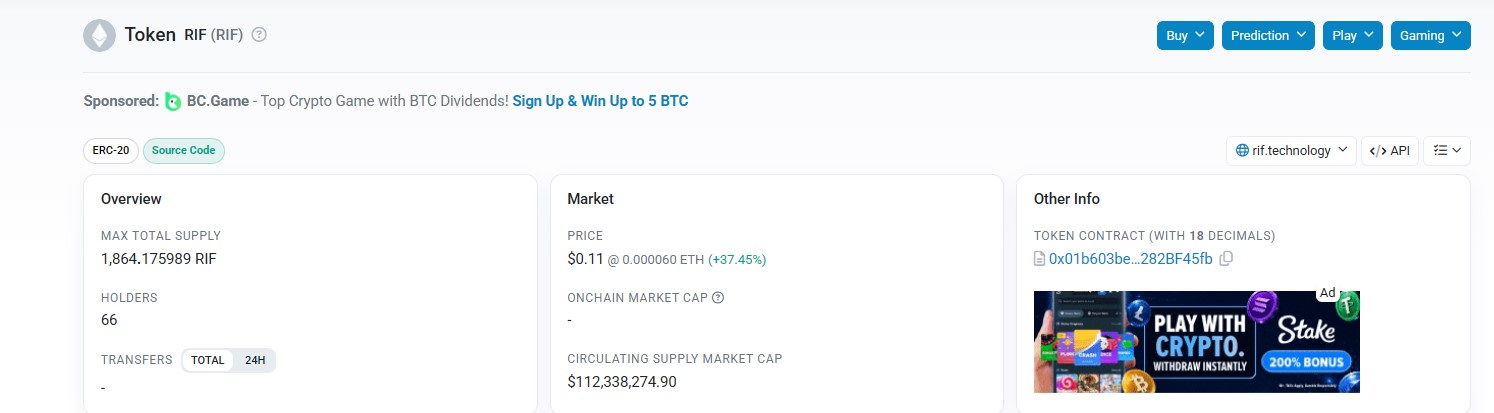
That wasn't always the design. RIF Labs' original token sale documentation, published on theofficial Rootstock website, outlined a phased release: roughly 35-40% went to private sale contributors, about 40% was retained by RIF Labs and unlocked at a rate of 1/60th per month over 5 years, and 20% was allocated to RSK Labs' shareholders, founders, and management, unlocked at 1/48th per month over 4 years following a 6-month cliff. No tokens were sold to the public directly; instead, 21 million RIF were earmarked for early adopters through bounty and adoption programs. All of that vesting has long since run its course, which is consistent with the fully circulating supply seen today.
Holder Concentration Caveat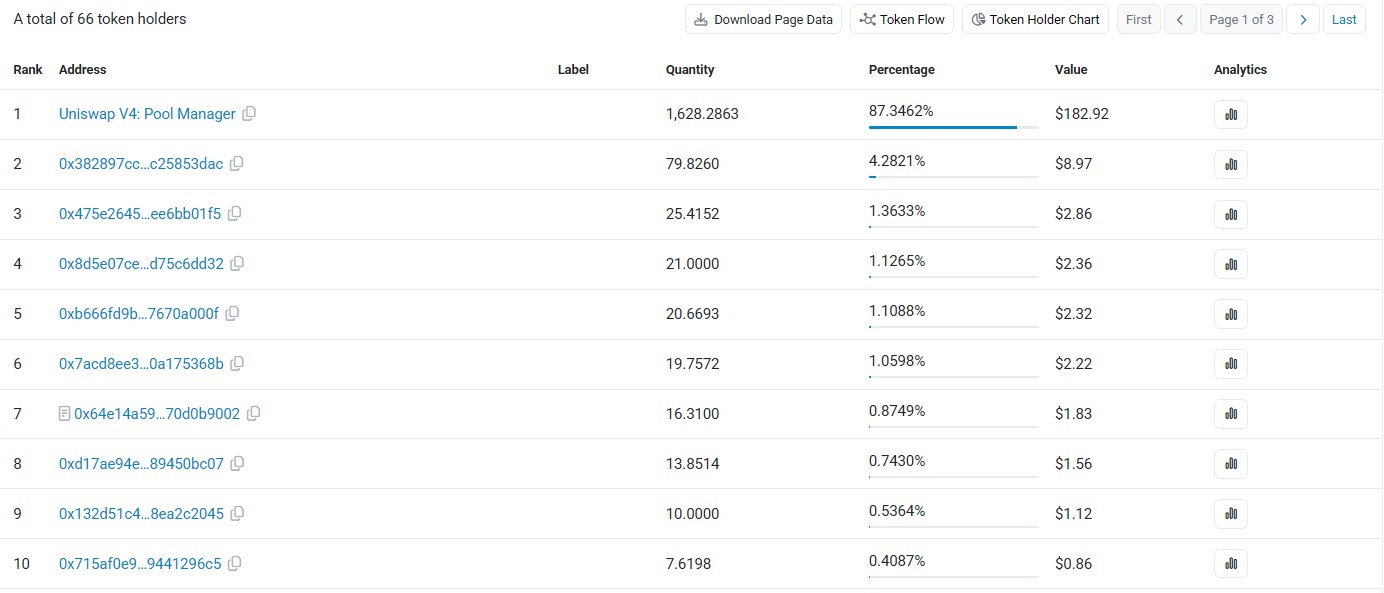
On holder concentration, the picture needs a caveat. CoinMarketCap lists just 81 total holders for RIF, an unusually low number for a token with a $113M market cap, and a separateon-chain holder data snapshot shows only 66 addresses holding RIF within the specific pool it tracked. In that snapshot, the top wallet by far is a Uniswap V4 Pool Manager contract holding 87.35% of the sampled supply, which reflects liquidity pool custody rather than a single actor accumulating tokens; that pool-custody pattern is worth keeping in mind next to how aUniswap buyback program affects a protocol's own token flows. Top 100 concentration in that same snapshot reads 99.98%, with the top 5 addresses controlling 95.22% and the top 10 controlling 98.84%. The Gini score for that sample sits at 0.9676, and six holders individually control at least 1% of the sampled supply.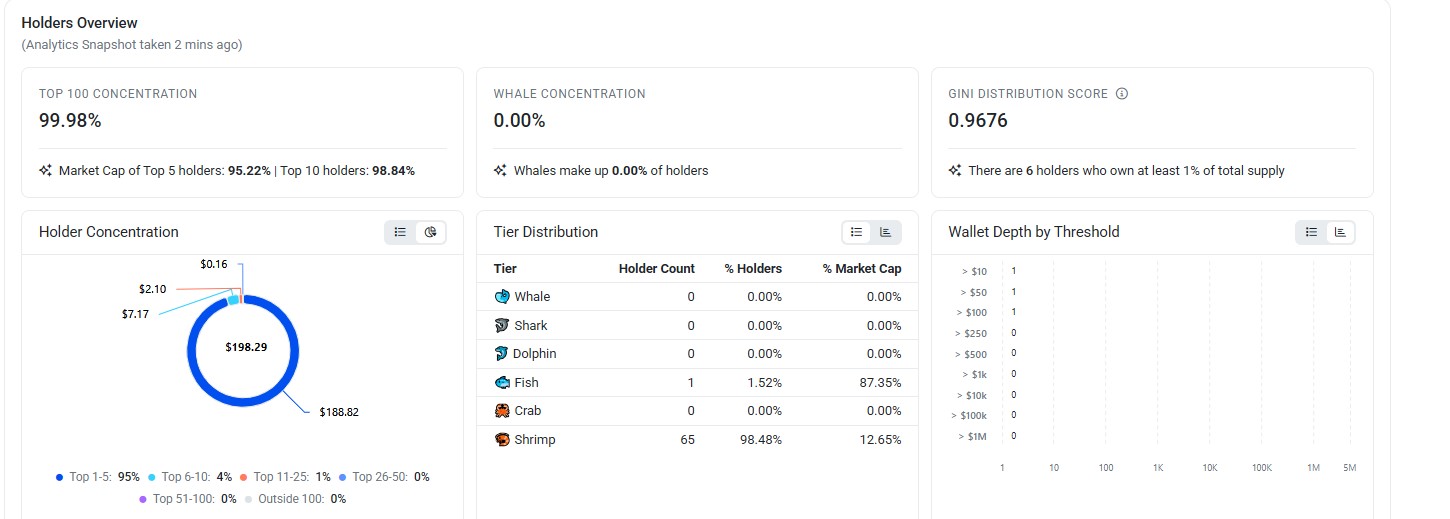
A wallet controlling the majority of a sampled pool is not a footnote, similar in spirit to theXRP whale accumulation pattern flagged in recent coverage, though the underlying mechanics here (a DEX pool contract vs. a personal wallet) are different enough to matter.
Liquidity and Exchange Volume
Liquidity relative to market cap sits at just 0.02%, thinner than typical for a token of this size. Thin liquidity like this means larger orders can swing price more than they would on a deeper market in either direction, and it also helps explain how a relatively modest catalyst produced a near 40% daily move.
Futures volume is heavily concentrated on one venue. Binance leads by a wide margin at $616.52M, dwarfing every other exchange tracked. Behind it, Bitunix shows $31.28M, Gate around $21.88M, MEXC $19.38M, and KuCoin $17.44M, with BingX rounding out the smaller venues, a distribution that can be cross-checked live onCoinglass's exchange volume tracker.
That kind of lopsided concentration on a single exchange, combined with thin spot liquidity, is worth treating as a caution flag. It points to leveraged futures speculation driving the move more than broad-based spot accumulation, not unlike the exchange-driven volume spike scrutinized around the recentSolana exchange listing rally.
Futures Volume by Exchange
Exchange24H Futures VolumeBinance$616.52MBitunix$31.28MGate$21.88MMEXC$19.38MKuCoin$17.44M
Bull, Base, and Bear Scenarios
None of this is financial advice. These are scenario-based estimates built from current chart structure, not guarantees.
Bull Case
A daily close above $0.14939 (clearing both the 4h resistance and the weekly channel ceiling) opens a path toward $0.18919 within 7 to 14 days. Probability: moderate, roughly 30%, contingent on short interest staying light and Bitcoin's institutional-adoption narrative staying in headlines, a dynamic also playing out in currentcapital rotation trends between major assets. Invalidation: a daily close back below $0.095.
Base Case
Price consolidates between roughly $0.08 and $0.15 over the next 7 to 30 days as the squeeze unwinds and the weekly chart works to confirm or reject the channel breakout. Probability: highest, roughly 45%. Invalidation: a clean weekly close outside either boundary.
Bear Case
Momentum fades, the descending channel reasserts itself, and price retraces toward the $0.07931 support zone, with a deeper test of $0.04210 possible within 30 days if broader Bitcoin sentiment cools, echoing caution flagged in the currentEthereum price forecast for tokens tied closely to a single base layer narrative. Probability: roughly 25%. Invalidation: sustained volume holding above $0.11 for more than a week.
Price Forecast Table
TimeframeBearBaseBull24H$0.095$0.113$0.1357D$0.080$0.110$0.15030D$0.055$0.100$0.1902026 (Year-End)$0.030$0.090$0.300
These figures aren't predictions of certainty. They're ranges built around the support and resistance levels already on the chart.
Key Risks
Thin liquidity tops the list. A 0.02% liquidity-to-market-cap ratio means slippage risk on anything beyond small orders, and it makes the price more reactive to concentrated futures positioning than to genuine demand.
Distance from all-time high is a structural reminder. Price sits roughly 75% below its 2021 peak, and today's bounce, however sharp, is happening inside a much longer downtrend that hasn't been reversed yet on a weekly close.
Holder data quality deserves scrutiny. The available on-chain snapshot appears to capture a single liquidity pool rather than the full 1 billion token supply; anyone sizing a position should verify concentration independently before treating those percentages as the full picture.
Exchange concentration on the futures side, with Binance carrying the overwhelming majority of tracked volume, means this move is currently being driven more by leveraged derivatives trading than broad spot demand.
No unlock catalyst either way. There's no dilution risk from token unlocks (supply is fully circulating), but that also means there's no scheduled catalyst on that front, so price action here is purely sentiment- and flow-driven for now. Keep an eye on thecrypto events calendar for anything that could shift that.
Sector-wide swings in the wider altcoin market can override token-specific setups entirely, so RIF's chart should always be read alongside overall market conditions, which are covered in the widercrypto price prediction hub.
Glossary
RSI (Relative Strength Index):A 0-100 momentum indicator. Above 70 typically signals overbought; below 30 signals oversold.
EMA (Exponential Moving Average):A trend-following average that weights recent prices more heavily than older ones.
FDV (Fully Diluted Valuation): What the market cap would be if every token that will ever exist were already circulating.
Gini Score:A measure of distribution inequality, from 0 (perfectly even) to 1 (total concentration).
Liquidation: The forced closing of a leveraged position when losses exceed the trader's margin.
PowPeg: Rootstock's two-way bridging mechanism that backs rBTC 1:1 with Bitcoin.
Invalidation Level:The price point at which a trading thesis is considered wrong and should be abandoned.
Disclaimer: This article is for informational purposes only and does not constitute financial advice. Cryptocurrency markets are highly volatile. Always do your own research and consult a licensed financial advisor before making investment decisions.