BitcoinWorld S&P 500 Faces Bearish September Setup: Seasonality Aligns with Potential Drop Toward 7,100–7,200 The S&P 500 is facing a bearish September setup as seasonal weakness aligns with
BitcoinWorld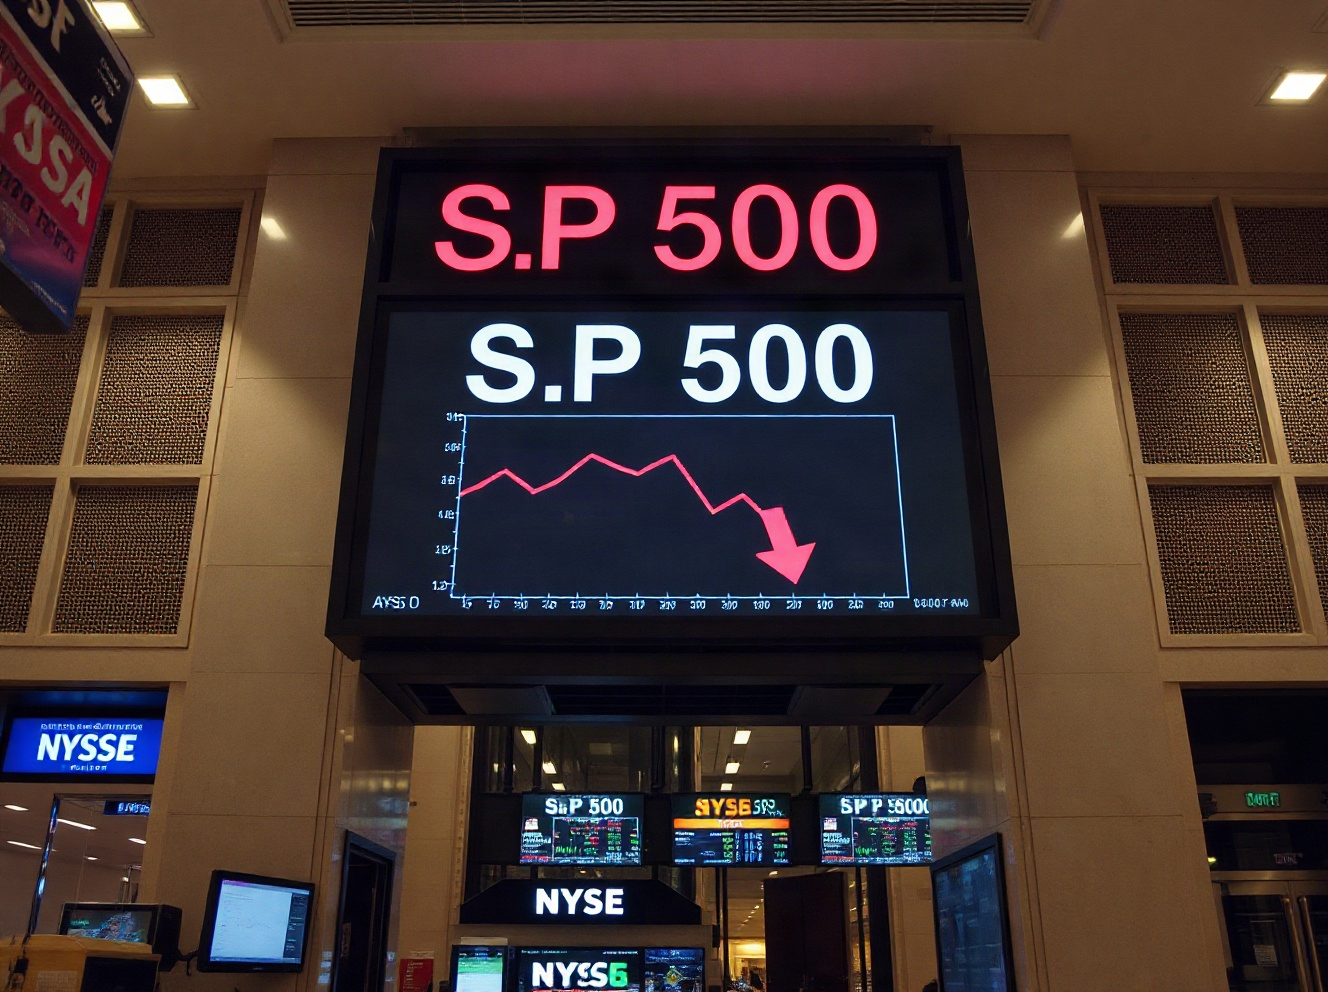 S&P 500 Faces Bearish September Setup: Seasonality Aligns with Potential Drop Toward 7,100–7,200
The S&P 500 is facing a bearish September setup as seasonal weakness aligns with a technical pattern suggesting a possible five-wave decline toward the 7,100–7,200 range, according to chart analysis.
Seasonal Headwinds and Technical Signals
September has historically been the weakest month for U.S. equities, with the S&P 500 averaging a decline of about 0.7% over the past several decades. This year, the seasonal drag is compounded by a technical formation that analysts interpret as a five-wave downward structure, a pattern often associated with Elliott Wave theory.
The projection of a drop to 7,100–7,200 would represent a significant correction from current levels, which have hovered near all-time highs. As of early September 2025, the index trades around 7,500, so the target implies a decline of roughly 4–5%.
What the Chart Suggests
Technical analysts point to a series of lower highs and lower lows on the daily chart, which aligns with the early stages of a five-wave impulse down. The pattern is still unconfirmed, and a break above recent resistance would invalidate the bearish count.
Key support levels to watch include the 7,300 area, which has acted as a floor in recent sessions, followed by the 7,100–7,200 zone, where the 200-day moving average and prior consolidation converge.
Why This Matters to Investors
For investors, a potential drop to 7,100–7,200 would affect portfolio valuations and could trigger increased volatility. Understanding the technical and seasonal context helps in making informed decisions about risk management and entry points.
However, technical patterns are probabilistic, not certain. Market participants should consider broader economic data, Federal Reserve policy, and earnings trends before acting on any single signal.
Conclusion
While the S&P 500 faces a bearish September setup with seasonality and technicals pointing lower, the market remains data-dependent. Traders will watch for confirmation of the five-wave pattern and key support levels in the coming weeks.
FAQs
Q1: What is the five-wave drop pattern?A five-wave drop is a technical analysis concept from Elliott Wave theory, suggesting a downward move occurs in five distinct waves. Analysts use this to project potential price targets, such as the 7,100–7,200 range for the S&P 500.
Q2: How reliable is September seasonality for stocks?September has historically been the weakest month for U.S. stocks, but it is not a guarantee. Seasonality is one of many factors; actual market performance depends on economic data, earnings, and geopolitical events.
Q3: What should investors do if the S&P 500 drops to 7,100?Investors should evaluate their risk tolerance and long-term goals. A drop to that level may present buying opportunities for some, but it is essential to consult with a financial advisor and consider diversification.
This post S&P 500 Faces Bearish September Setup: Seasonality Aligns with Potential Drop Toward 7,100–7,200 first appeared on BitcoinWorld.