BitcoinWorld S&P 500 Technical Outlook: Price Consolidates Between Arc Levels, Potential Upside to 7,790 The S&P 500 index (SPX500USD) is currently navigating between key arc levels on the te
BitcoinWorld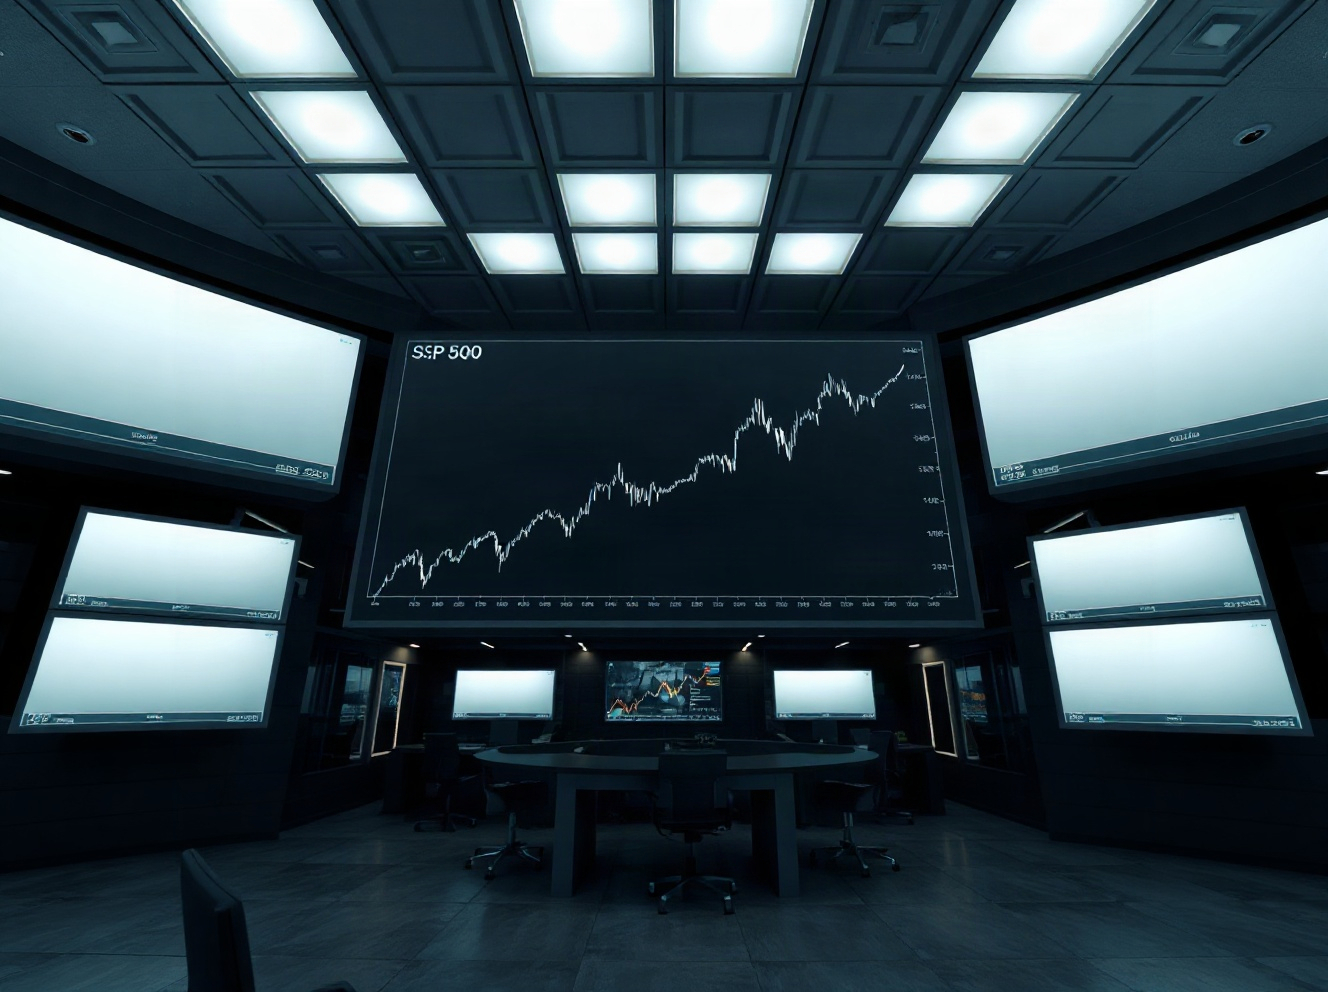 S&P 500 Technical Outlook: Price Consolidates Between Arc Levels, Potential Upside to 7,790
The S&P 500 index (SPX500USD) is currently navigating between key arc levels on the technical chart, with analysts suggesting a potential continuation toward the 7,790 mark if current support holds.
Price Action and Key Arc Levels
As of the latest trading session, the index is consolidating within a defined range, bounded by what technical analysts refer to as arc levels. These levels are derived from circular or semi-circular price projections and are used to identify potential support and resistance zones that differ from traditional horizontal or trendline analysis.
The current price action shows the index testing the lower boundary of this arc formation, which has historically acted as a strong support area. A successful hold above this level could provide the necessary momentum for a push toward the upper arc target of 7,790.
Implications for Traders and Investors
For traders, the key level to watch is the lower arc boundary. A decisive break below this level could signal a deeper correction, while a bounce would reinforce the bullish continuation scenario. The 7,790 target represents a significant upside from current levels, implying a move of several percentage points.
Investors with a longer-term horizon may view this consolidation as a healthy pause within a broader uptrend. The arc levels provide a structured framework for assessing risk, with the lower boundary offering a clear level to monitor for potential portfolio adjustments.
Why This Matters
Understanding these technical levels is crucial for market participants as they provide concrete price points for decision-making. The S&P 500 is a benchmark for the broader U.S. equity market, and its movements have ripple effects across global markets, influencing everything from retirement accounts to international investment flows.
Conclusion
In summary, the S&P 500’s price action between arc levels presents a clear technical setup. The potential continuation toward 7,790 hinges on the index holding its current support. As with all technical analysis, these levels are not guarantees but rather probabilities based on historical price behavior. Market participants should monitor these levels closely in the coming sessions.
FAQs
Q1: What are arc levels in technical analysis?Arc levels, often derived from Fibonacci arcs or similar geometric projections, are curved support and resistance lines that rise or fall over time. They are used to identify potential price reversal points that differ from straight horizontal or diagonal lines.
Q2: What is the significance of the 7,790 price target?The 7,790 target is identified as the upper boundary of the current arc formation. It represents a potential resistance level where the price could face selling pressure if it reaches that point, based on the geometric projections of the arc.
Q3: How reliable is this technical analysis for predicting the S&P 500’s direction?Technical analysis, including arc levels, is a probabilistic tool, not a guarantee. Its reliability depends on the timeframe and market conditions. It is most effective when combined with other indicators and fundamental analysis to form a comprehensive market view.
This post S&P 500 Technical Outlook: Price Consolidates Between Arc Levels, Potential Upside to 7,790 first appeared on BitcoinWorld.