What to Know SCRT is attempting to reclaim the Bollinger Band midpoint as buyers gradually return. RSI has climbed to 46.31, signaling improving momentum after recovering from oversold condit
What to Know
- SCRT is attempting to reclaim the Bollinger Band midpoint as buyers gradually return.
- RSI has climbed to 46.31, signaling improving momentum after recovering from oversold conditions.
- Long-term projections suggest SCRT could revisit the $0.10 psychological level before 2030.
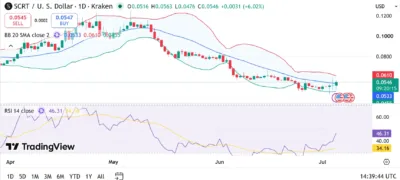
Secret (SCRT) is showing early signs of recovery after enduring months of sustained selling pressure that pushed the privacy-focused cryptocurrency to its lowest levels of the year. The latest TradingView chart shows SCRT trading around $0.0546 after posting a strong daily gain that lifted the token toward the Bollinger Band midpoint.
Momentum indicators are also improving. The Relative Strength Index (RSI) has risen to 46.31 while remaining above its moving average of 34.16, suggesting bearish momentum is fading as buyers slowly regain confidence.
Although SCRT continues to trade below the 20-day Bollinger Band average near $0.0533 and remains well below the upper band at $0.0610, recent price action indicates the token could be building a base for a broader recovery if bullish momentum continues.
Also Read: JasmyCoin (JASMY) Price Prediction 2026–2030: Can JASMY Hit $0.10?
Buyers Attempt to Reverse Multi-Month Downtrend
SCRT enjoyed a steady rally during April before reaching highs above $0.10, but the momentum faded throughout May as sellers regained control. A prolonged decline followed, sending the token below multiple support levels while price consistently traded beneath the Bollinger Band midpoint.
Selling pressure intensified in June, driving SCRT toward the lower Bollinger Band around $0.0455. However, buyers stepped in near that support, allowing the token to stabilize and begin forming higher lows over recent sessions. The latest bullish candle has pushed SCRT back toward the middle Bollinger Band, suggesting that market sentiment is gradually improving even though the broader trend has yet to fully reverse.
Technical Analysis
The technical outlook is beginning to improve as SCRT attempts to establish itself above short-term resistance. The Bollinger Band midpoint near $0.0533 now serves as the first level bulls must defend to maintain the recovery.
The upper Bollinger Band sits around $0.0610 and represents the next significant resistance zone. A decisive daily close above this level would strengthen the bullish outlook and could open the door for a move toward $0.070 before exposing the major psychological resistance at $0.10. Momentum indicators also support the improving picture. The RSI currently stands at 46.31 while its moving average remains at 34.16. Although the RSI is still below the neutral 50 level, the widening gap between the indicator and its signal line reflects strengthening buying momentum following an extended period of weakness.
On the downside, the lower Bollinger Band near $0.0455 remains the strongest support. Losing that level would invalidate the current recovery attempt and increase the risk of another leg lower.
Source: Tradingview
Secret (SCRT) Price Predictions (2026–2030)
YearMinimum PriceAverage PriceMaximum Price2026$0.05$0.07$0.092027$0.06$0.09$0.112028$0.08$0.11$0.142029$0.09$0.13$0.172030$0.10$0.15$0.20
Yearly Insights
2026
SCRT could continue recovering from its prolonged correction while attempting to establish a sustained move toward the $0.09 resistance zone.
2027
A broader cryptocurrency market recovery may help SCRT reclaim the important $0.10 psychological level.
2028
Improving investor confidence and continued ecosystem development could support a rally toward the $0.14 region.
2029
If buying momentum strengthens during the next market cycle, SCRT may extend gains toward $0.17 as demand improves.
2030
A favorable macro environment and sustained blockchain adoption could allow SCRT to challenge the $0.20 level during the next major bull market.
Conclusion
SCRT is beginning to show encouraging signs of stabilization after several months of heavy selling. The latest recovery toward the Bollinger Band midpoint, combined with an RSI reading of 46.31, indicates that bullish momentum is gradually returning even though the broader trend remains cautious.
The next major objective for buyers is reclaiming the upper Bollinger Band near $0.0610 before targeting the $0.10 psychological resistance. As long as SCRT continues holding above the $0.0533 support area and momentum keeps improving, the probability of a stronger recovery will continue to increase.
FAQs
1. Why is SCRT recovering?
The token has rebounded from strong support near $0.0455 as buyers returned following several weeks of sustained selling pressure.
2. What is the next major resistance?
Immediate resistance sits around the upper Bollinger Band near $0.0610, followed by the important psychological level at $0.10.
3. What does the RSI indicate?
An RSI reading of 46.31 shows momentum is improving after recovering from oversold conditions, although it remains below the neutral 50 level.
4. Which support level should traders monitor?
The Bollinger Band midpoint around $0.0533 serves as immediate support, while the lower Bollinger Band near $0.0455 remains the strongest downside support zone.
Also Read: Vlad Tenev: Early Life and Net Worth – The Robinhood Chairman Transforming Global Finance
The post Secret (SCRT) Price Prediction 2026–2030: Can SCRT Hit $0.10 Soon? appeared first on 36Crypto.