SHIB remains inside a tightening formation, with rising support meeting descending resistance near the current trading range today. Price action has slowed near $0.00000506, while narrowing B
- SHIB remains inside a tightening formation, with rising support meeting descending resistance near the current trading range today.
- Price action has slowed near $0.00000506, while narrowing Bollinger Bands show reduced volatility across recent trading sessions overall.
- MACD momentum has weakened, leaving the next break above resistance or below support as the key chart development ahead for SHIB now.
SHIB price is consolidating within a narrowing daily structure, as rising support and falling resistance keep direction unresolved.
Whales Care described SHIB as waking up through slower market movements. The post also pointed to continued community strength around the token.It presented the current activity as progressive and not indicative of a significant move.
https://twitter.com/WhalesCare/status/2098255904135389211?s=20
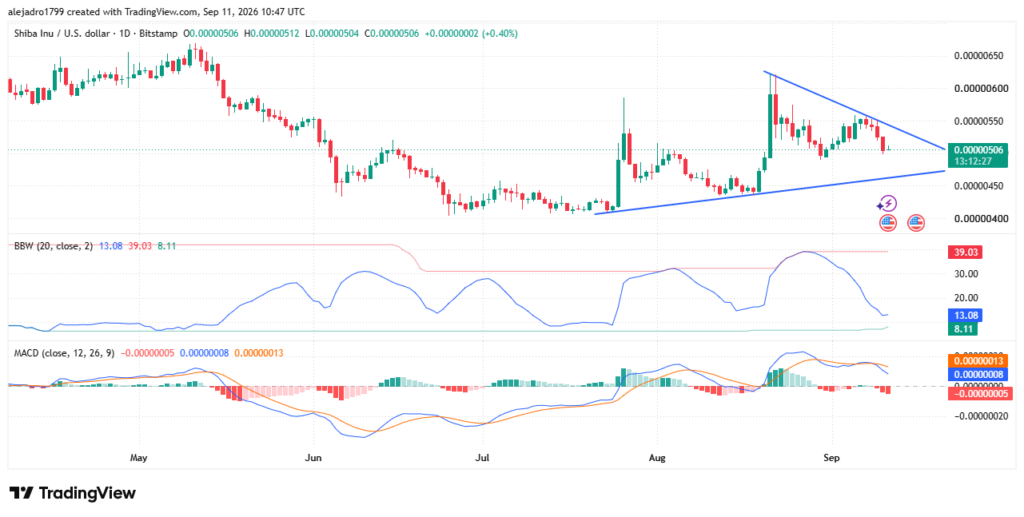
After some consolidation in the daily time frame, SHIB is closing in on $0.00000506 on the chart. Price had previously fallen from $0.00000650-$0.00000430. Selling pressure subsided after buyers built a wider base.
Source:
TradingviewThe chart shows that recovery began around July, after the price approached $0.00000410. Since then, several higher lows have developed along rising support. That sequence contrasts with the descending resistance formed after the August recovery.
Recent candles remain beneath the upper trendline extending from the August high. Sellers have appeared repeatedly near that declining boundary. Meanwhile, buyers have continued defending the rising lower boundary.
Bollinger Bands Show Volatility Compression
The tightening structure is supported by the Bollinger Band Width indicator. Its latest reading stands near 13.08 after reaching substantially higher levels earlier. The decline indicates that daily price volatility has contracted considerably.
That contraction follows the sharp price expansion seen during August. Price briefly moved toward approximately $0.00000620 before retreating into the current structure. Since then, daily movements have become progressively more contained.
The current SHIB price remains positioned between the two converging trendlines. The upper boundary provides immediate resistance for any recovery attempt. The lower boundary remains the nearest structural support for continued consolidation.
A sustained move above descending resistance would change the present formation. Such a move would indicate that buyers have overcome the structure containing recent rebounds. Conversely, losing rising support would place earlier consolidation lows back into focus.
MACD Keeps Directional Confirmation Pending
The MACD currently provides weaker momentum than during the previous recovery phase. The latest histogram is slightly negative on the displayed chart. The MACD line has also moved below its signal line.
That shift follows the stronger positive momentum recorded during August. The earlier move produced expanding green histogram bars alongside a sharp price advance. Recent readings instead show momentum fading as price consolidates.
The broader chart therefore presents a market awaiting a clearer directional signal. Rising support continues protecting the recent higher-low sequence. At the same time, descending resistance keeps upside attempts contained.
The Whales Care message fits this quieter technical phase. Its reference to slow moves matches the reduced volatility visible across the chart. For now, the next major signal remains a confirmed break from the tightening structure.