SHIB approaches a five-year descending trendline, placing the market near a major structural test after years of lower highs. The momentum has dried up greatly as selling pressure mounts with
- SHIB approaches a five-year descending trendline, placing the market near a major structural test after years of lower highs.
- The momentum has dried up greatly as selling pressure mounts with RSI at 34 and MACD below the signal line.
- A confirmed trendline breakout could change the structure, while rejection would preserve the long-term bearish pattern.
SHIB price is approaching a long-standing descending trendline after years of lower highs, placing the token near a major technical decision.
Five-Year Downtrend Reaches a Critical Test
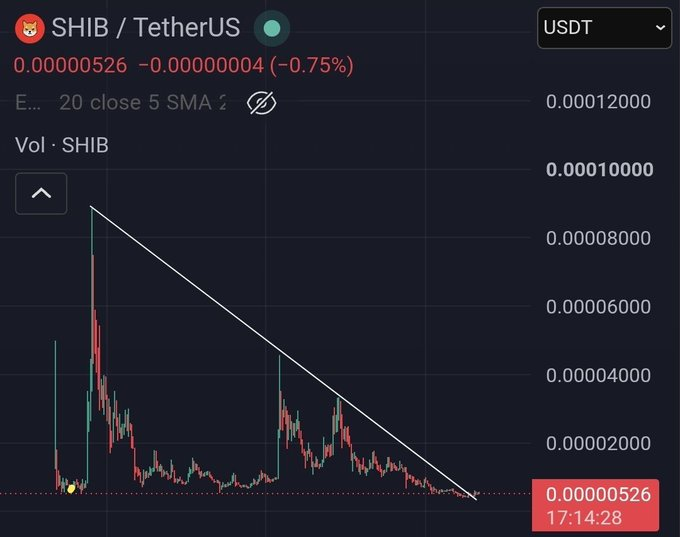
The chart shows a descending resistance line extending from the 2021 peak. That trendline has contained several major recovery attempts since then. Each rejection produced another lower high across the broader market structure.
Source:
XPrevious rally seen to 0.00004000 and 0.00008000 but reversed strongly. The moves gained considerable volume but did not form any meaningful upward trends. Price subsequently returned toward progressively lower trading ranges.
The latest structure looks different because price has compressed near resistance. The distance between recent highs and lows has narrowed considerably. This compression places greater attention on the trendline’s immediate reaction.
Crypto SHIB recently described the development as a potential major breakout. The post pointed toward resistance dating back to October 2021. It also suggested stronger movement could follow if that barrier breaks.
Momentum Indicators Show Renewed Selling Pressure
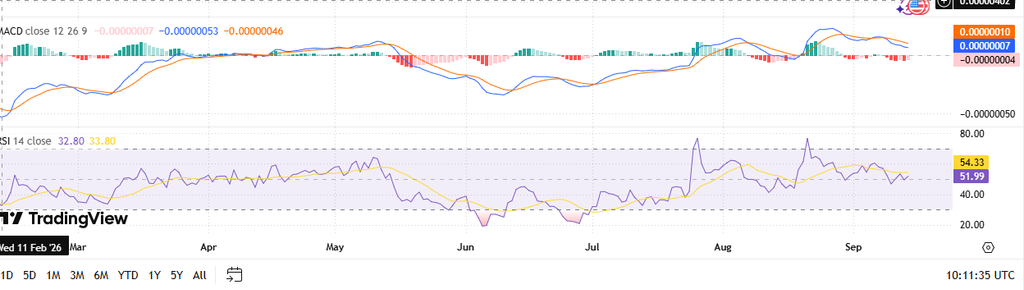
The MACD as of writing shows bearish momentum after August's stronger reading. The blue MACD line has moved beneath the orange signal line. Its histogram is also negative, indicating weakening momentum across recent sessions.
Source:
TradingviewThe latest histogram reading sits around -0.00000004 on the supplied chart. That reading follows stronger positive momentum recorded during August. The subsequent decline shows buying strength has faded considerably.

The RSI provides another indication of weakening market momentum. Its latest reading stands near 33.84, below the neutral 50 level. The indicator is approaching the traditional oversold threshold near 30.
Earlier RSI readings climbed above 80 during stronger market advances. Those elevated readings were followed by repeated declines toward lower levels. The latest move therefore reflects another substantial deterioration in momentum.
Breakout Confirmation Remains Essential
The supplied market data places SHIB at $0.055238 as of the time of writing. Meanwhile, the chart itself shows price near the long-term trendline.That resistance remains the central technical level in the current structure.
A confirmed break would require sustained trading above the descending trendline. Expanding volume would provide additional confirmation for such a move. Without stronger participation, a brief breakout could still fail.
The chart shows considerably lower recent volume than during earlier rallies. That difference separates the current setup from previous explosive price advances. Therefore, volume remains an important factor during any attempted breakout.
A rejection would leave the multi-year descending structure intact. Price could then continue consolidating near the lower end of its range. As of writing, the trendline remains the clearest technical boundary for SHIB.