SHIB has recovered from its early-morning low, but the latest chart still shows resistance above the current trading range. Binance dominates the chart of inflows with $8.27 million and Gate'
- SHIB has recovered from its early-morning low, but the latest chart still shows resistance above the current trading range.
- Binance dominates the chart of inflows with $8.27 million and Gate's is the biggest number on the other side.
- Exchange activity remains uneven, with isolated netflow spikes failing to establish a lasting direction across the displayed period.
SHIB price action remains unsettled after a sharp reversal erased much of its earlier advance. The latest session shows continued pressure, while exchange flows remain divided. Buyers are still attempting to recover ground lost during the decline.
The Downtrend Break Faces Another Test
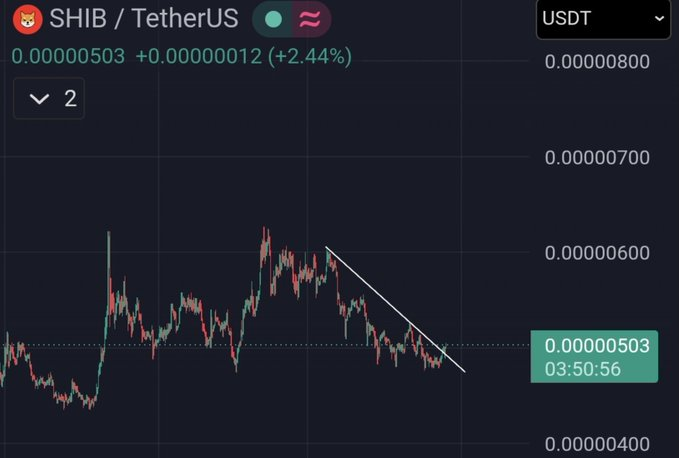
Crypto SHIB argues that SHIB has broken its downtrend and could follow PEPE’s rally. The previous chart indicated that the price was moving towards a descending trendline at $0.00000503. That line connected lower highs formed after an earlier peak around $0.0000060.
Source:
X
Price had struggled to regain previous highs during that decline. The latest approach towards the trendline offered an early change in direction. But a quick pull-over resistance is not a permanent trend change.
The broader time frame also reveals a series of failed attempts to rally. The previous chart had some support levels around $0.0000052 and $0.0000054. Outside of that area the prior consolidation near $0.0000055 is still valid.
The current snapshot shows a different price for trading at $0.0000054672. It also fell by 4.02% today, indicating that recovery is not even. The two readings on the chart are not prices at the same time.
Exchange Flows Show Uneven Activity
The exchange breakdown places Binance first in the displayed inflow figures. Its recorded amount stands at approximately $8.27 million. OKX follows with $4.41 million, while Bybit records $3.76 million.
Gate records about $2.89 million in the same panel. The opposite panel shows Gate at approximately $80,610. Kraken follows with $16,560, while Binance records around $12,130.
The difference between these exchange figures shows uneven activity. Binance leads one side, while Gate dominates the other. These readings do not establish whether the movements represent buying or selling intent.

Daily netflow bars also alternate between positive and negative readings. There is a large positive peak around July 23 and a strong negative bar. Later months have minor oscillations without a clear trend.
Price Levels and Market Activity Remain in Focus
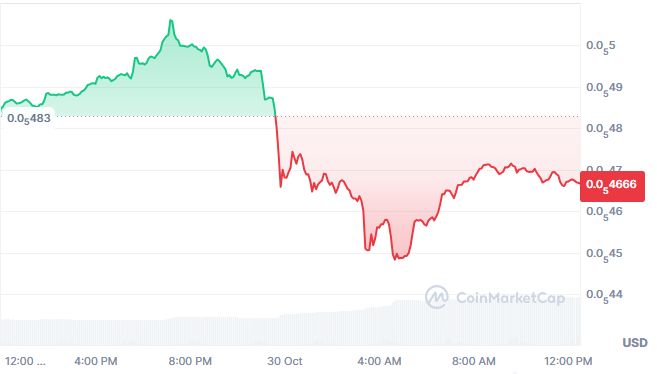
The latest chart shows an earlier climb from approximately $0.00000483. SHIB then approached the $0.0000050 region before dropping sharply. The decline continued towards $0.0000045 during the early morning.
Source:
Coinmarketcap
Buyers later lifted the price from that low. But the turnaround wasn't a complete turnaround. Price then fluctuated in a smaller envelope, between $0.0000047 and $0.0000053.
The $0.0000045 area is a crucial support level. A break beneath it would place the recent low under renewed pressure. Meanwhile, $0.0000048 marks an area buyers would need to reclaim.
The latest market data reports a 24-hour volume increase of 80.39%. Market capitalization stands near $2.75 billion, with approximately 3.09 million holders. Higher volume during a declining session points to increased trading activity.
The structure of the short chart will improve if this could sustain above $0.0000048. Further resistance appears around $0.0000052 to $0.0000054. A stronger recovery would need to clear those levels.
The PEPE comparison remains a possibility raised by the social-media post. The supplied charts do not establish that both tokens will follow similar paths. For SHIB, holding support and reclaiming nearby resistance remain the immediate chart tests.