SHIB recovery needs sustained demand because the token remains roughly 94% below its former $0.00008845 all-time high, former peak. Recent liquidation spikes show leveraged SHIB positions rem
- SHIB recovery needs sustained demand because the token remains roughly 94% below its former $0.00008845 all-time high, former peak.
- Recent liquidation spikes show leveraged SHIB positions remain vulnerable during abrupt market moves across major trading venues again.
- Reclaiming $0.000005114 could improve near-term structure, while $0.0000049 remains a key downside level for active traders today too.
SHIB recovery remains uncertain as the token stays far below its 2021 peak. Recent volatility and liquidations keep traders focused on nearby levels, while holders debate another record.
ATH Gap Keeps Long-Term Debate Alive
SHIB POSSESSOR recently asked holders whether SHIB could revisit its all-time high someday. The post asked supporters to raise their hands if conviction remained. SHIB's response to the question is even further removed from its 2021 record.
https://twitter.com/SHIBpossessor/status/2094187645136237044?s=20
As per the market data provided as of 28 October 2021, SHIB is trading at $0.00008845. Unlike the open source, the token has lost a lot of value and has fallen to about $0.00000504. This puts the asset down about 94% from its previous record.
A return to the former peak would require about a 17.5-fold increase. Such a move would require sustained demand across a much broader market cycle. It would also need liquidity and participation to expand considerably.
The circulating supply adds another consideration to the ATH discussion. Supplied data lists about 589.23 trillion SHIB in circulation today. At $0.00008845, that supply would imply a much larger valuation.
Price Action Tests Nearby Resistance
There has been a significant sell-off in recent days with a slight recovery. SHIB as of writing trades at $0.000005059, down 1.16% over 24 hours. The market capitalization is approximately $2.98 billion and the volume is approximately $79.8 million.
Price briefly moved into positive territory above $0.0000052, but then returned to the sellers. The decline then pushed through the $0.00000515–$0.0000052 area. Selling accelerated until price approached approximately $0.0000049.

Buyers responded around $0.0000049 and pushed the price back above $0.0000050. The rebound remains uneven, with resistance near $0.0000051–$0.000005114.If the price rises above this point, then the previous high of $0.0000052 would come into play.
However, when the price approaches the resistance, it could get reversed back to $0.0000050. The recent low would be retested with a $0.0000049 loss. Therefore, those levels remain central to the immediate market structure.
Liquidations Reveal Leverage Risk
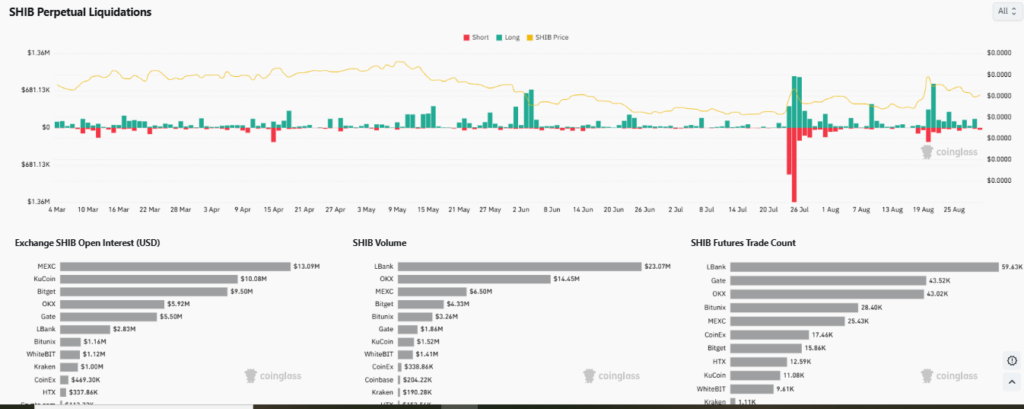
The perpetual liquidation chart records several sharp episodes between March and late August. Most daily activity remained comparatively contained outside major volatility events. The largest liquidation cluster appeared around July 24–25.
Source:
CoinglassThat period produced a red liquidation spike near $1.36 million. Green liquidation activity also appeared at substantial levels around the same period. The combined activity points to rapid position closures during heightened price movement.
Another major episode emerged around August 19–20. Green liquidations approached or exceeded $680,000, while red activity also increased. Meanwhile, SHIB prices jumped sharply before retreating from higher levels.
Exchange data shows MEXC leading open interest at about $13.09 million. KuCoin followed with $10.08 million, while Bitget recorded $9.50 million. LBANK led displayed volume at $23.07 million and futures trades near 59.63K.