SHIB recovery remains a market theme as price trades near $0.0000058, while derivatives activity continues across leading exchanges. Large July liquidations have faded, but September activity
- SHIB recovery remains a market theme as price trades near $0.0000058, while derivatives activity continues across leading exchanges.
- Large July liquidations have faded, but September activity shows leveraged traders remain active across several major trading venues.
- MEXC leads open interest, while OKX leads volume and LBank records the highest futures trade count among the listed exchanges shown today.
SHIB recovery remains a market theme as derivatives activity stays elevated across several major exchanges. The latest chart shows reduced liquidation pressure after July’s sharp volatility across the market.
July Liquidations Set the Derivatives Backdrop
The perpetuals chart records its largest liquidation episode around July 23–26. Red bars expanded sharply, showing heavy short-position liquidations during that period. Green bars also appeared, indicating long traders faced forced closures as volatility intensified.
After that episode, liquidation bars became smaller across August and September. However, several isolated spikes emerged around August 20–24 and later September. These movements show that leveraged positioning continued despite calmer overall liquidation activity.
The SHIB price line also recovered after the July weakness visible on the chart. Price movements became firmer during late August and September, although fluctuations remained frequent. The chart therefore presents recovery alongside continuing derivatives-driven volatility.
SHIB as of writing trades at around $0.0000058 according to coinmarketcap data . That level remains well below the historical peak reached during the 2021 crypto market cycle. The distance from that record gives context to the bullish comeback narrative presented by the accompanying graphic.
Exchange Data Shows Broad Derivatives Participation
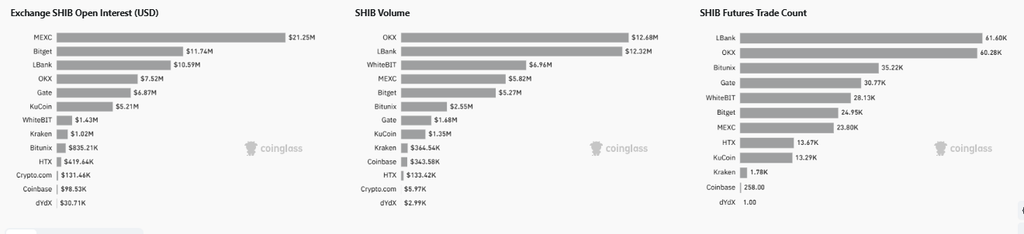
MEXC currently records the largest reported SHIB open interest at $21.25 million. Bitget follows with $11.74 million, while LBank holds $10.59 million. OKX and Gate also report substantial open interest at $7.52 million and $6.87 million.
Source:
Coinglass
The distribution shows that leveraged exposure is spread across multiple trading venues. MEXC accounts for the largest position base among exchanges shown on the chart. Meanwhile, several other platforms maintain multi-million-dollar open interest figures.

Volume data adds another layer to the market picture across the listed venues. OKX leads with $12.68 million, followed closely by LBank at $12.32 million. WhiteBIT records $6.96 million, while MEXC and Bitget post $5.82 million and $5.27 million.
Futures trade counts remain active across the same group of exchanges. LBank leads with 61.60K trades, followed by OKX with 60.28K transactions. Bitunix records 35.22K, while Gate and WhiteBIT also show notable activity.
Bull Market Narrative Meets Derivatives Data
SHIBMortal framed SHIB around a possible future return to record highs. The post argues that holders could regret missing current prices if another bull market develops. Its message remains focused on long-term market expectations rather than a specific trading timeframe.
https://twitter.com/SHIBMortal/status/2103164422386757688?s=20
The accompanying image reinforces that message through a large metallic bull and rising arrows. Its “SHIB Comeback” and “The Bull Is Waking Up” wording presents a clear recovery narrative. However, the graphic does not provide technical levels, indicators, or a defined price target.
The historical all-time high provides the central reference for that bullish scenario. Reaching such a level would require sustained demand and renewed market participation. The current derivatives chart does not establish that such a move has started.
Instead, the available data shows a market balancing recovery with active leveraged trading. Liquidation intensity has moderated from July’s extreme levels, while exchange activity remains substantial. This leaves derivatives positioning as an important feature of SHIB’s current market structure.