SHIB’s reported 33,774,726% gain tops the graphic’s comparison, although its measurement period and calculation method remain undisclosed. Bitcoin’s displayed 569,772% return exceeds the list
- SHIB’s reported 33,774,726% gain tops the graphic’s comparison, although its measurement period and calculation method remain undisclosed.
- Bitcoin’s displayed 569,772% return exceeds the listed stock and gold gains, but comparable dates are needed for a fair assessment.
- Ecosystem projects including Shibarium and ShibSwap support the graphic’s broader narrative about development beyond SHIB’s meme-coin origins.
A performance comparison highlighting extraordinary historical returns is the star of SHIB, and ecosystem development is part of the story as to its growing recognition.
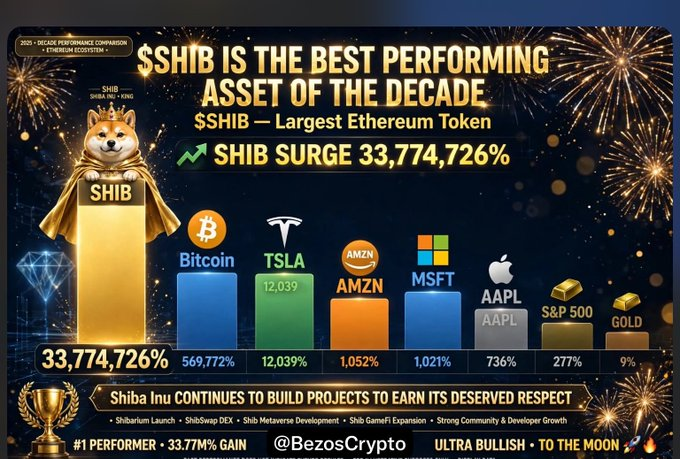
A graphic shared by BezosCrypto presents SHIB as the decade’s best-performing asset. It reports a gain of 33,774,726%, placing the token above every other listed asset. Bitcoin follows with a reported return of 569,772%.
Source: X
The comparison also lists Tesla at 12,039%, Amazon at 1,052%, and Microsoft at 1,021%. Apple appears with a gain of 736%, while the S&P 500 shows 277%. Gold trails the group at 9%, according to the graphic.
These figures establish the post’s central argument about SHIB’s historical price appreciation. However, these dates, ending dates, and data sources are not revealed in the graphic. Those omissions make it difficult for readers to check their own ranking from the image.
The claim needs more context as well, because SHIB didn't start at the beginning of the decade, but in 2020. So does its trading history, as it has only been recorded for a shorter period than 10 years. The ranking shown is based on the measurement window and calculation method used.
The reported return is heavily influenced by SHIB’s very low starting price. A small initial valuation can produce a huge percentage increase after a relatively modest nominal price movement. That percentage alone does not establish current market strength or investment quality.
Bitcoin’s reported gain offers another example of substantial historical appreciation. Yet comparing it with SHIB requires consistent dates and equivalent pricing methods. Without those details, the percentages should be treated as figures presented by the graphic.
There are additional variations introduced by stocks and indices. Businesses with operating revenues and corporate assets include Tesla, Amazon, Microsoft and Apple. The S&P 500 is not a single stock or security, but a collection of stocks from the United States.
Gold is a unique physical asset and potential store of value. The graphic doesn't explain if the stock dividends, reinvestment or inflation adjustments were included. These differences restrict conclusions that can be drawn from the displayed ranking.
In addition to its performance, the post highlights that Shiba Inu is still working on projects to increase its visibility. It mentions Shibarium, ShibSwap, metaverse development, GameFi expansion, and community participation.These elements shift attention from historical returns toward the project’s wider ecosystem.
Shibarium and ShibSwap represent distinct parts of that development narrative. But the naming of projects does not mean their adoption or economic contribution. Evidence of progress would be network activity, application usage, and continued participation.
Supply is also important to consider in the wider market position. Beyond unit price, there's context in terms of circulating supply, market capitalization, liquidity and the distribution of tokens. A large token supply can make nominal prices difficult to compare across assets.
The trophy, fireworks and elevated mascot further adds to the celebratory portrayal of the graphic. Those visual choices are a reflection of SHIB's past and future. They have no direct proof of returns or that previous achievements will endure.
In the end, the comparison gives a very bullish story based on reported returns and expansion of the ecosystem. Its ranking remains unverified because the underlying dates and calculation methods are absent. SHIB’s historical appreciation and project development are separate measures, each requiring its own supporting evidence.