SHIB is closing in on $0.0000060 as trendlines converge following a robust gain in September and a prior breakout. RSI remains above 50, while the slightly negative MACD histogram shows that
- SHIB is closing in on $0.0000060 as trendlines converge following a robust gain in September and a prior breakout.
- RSI remains above 50, while the slightly negative MACD histogram shows that short-term momentum has cooled during recent consolidation.
- A daily chart breakout above the Daily trendline would back up the Bull market, and a Daily trendline failure would lack support for the current setup.
SHIB is nearing a technical decision as price consolidates beneath resistance, while converging trendlines shape the market’s next potential move following September’s strong advance and breakout phase from earlier lows.
Accumulation Structure Builds Toward Breakout
BezosCrypto describes the earlier SHIB move as a parabolic accumulation phase. The post points to resistance breaks and stronger upward price movements. It frames former barriers as potential launchpads after repeated advances.

Source:
X
The supplied chart shows a prolonged accumulation period before September’s stronger upward move. Price then advanced through several resistance areas during that phase. Subsequent consolidation followed the latest upward expansion.
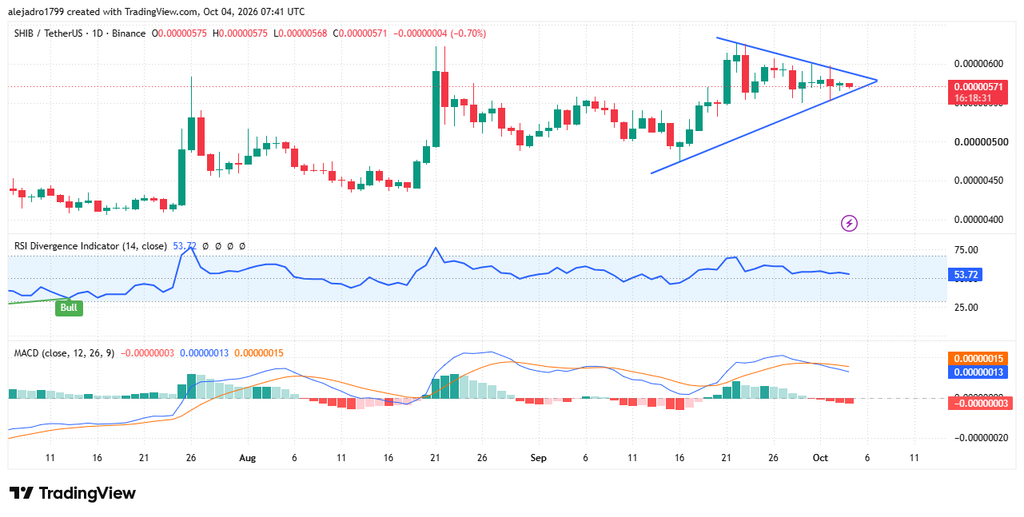
The latest daily chart shows SHIB consolidating after September’s strong advance. Price moved above $0.0000060 before retreating into a narrower range. Lower highs and higher lows now create converging boundaries.
That pattern forms a tightening symmetrical triangle beneath the main resistance zone. The upper trendline on the lower leg restricts any further rallying in the vicinity of $0.0000060. This has been a support in the consolidation process, the lower trendline which is ascending.
$0.0000060 Remains the Main Resistance
The displayed SHIB price is currently around $0.00000572. Price remains below resistance while holding above the rising support trendline. This keeps the market inside the tightening technical formation.
Source:
Tradingview
A breakout above the descending trendline would strengthen the current bullish structure. It would also move price beyond the existing consolidation boundary. A rejection would instead keep the triangle intact.

The Relative Strength Index currently reads 54.04 on the daily chart. That reading keeps momentum above the neutral 50 threshold. It also remains below traditionally overbought territory.
Earlier RSI strength accompanied the chart’s stronger upward price movements. The indicator later cooled as price entered consolidation. Its current reading shows positive momentum without excessive extension.
MACD Signals Cooling Momentum
The MACD provides a more cautious signal within the current structure. The MACD line remains below its signal line. The histogram is also slightly negative on the displayed chart.
These readings indicate that short-term momentum has cooled after September’s advance. Price action remains stronger while the ascending trendline holds. The indicators therefore present a mixed technical picture.
Breaking above the downward trend line would confirm the breakout situation. Any further upside might be backed up by more positive momentum in RSI. Without confirmation, resistance may continue restricting upward attempts.
The ascending trendline remains the key structural support beneath current price. A decisive break below it would weaken the present formation. Such movement could return attention toward earlier consolidation areas.
For now, SHIB remains defined by compression rather than confirmed continuation. The $0.0000060 region remains the primary resistance level to monitor. The next decisive move could determine the direction of the structure.