Shibarium processed 2,438 transactions on October 9, after 970 the day before. Several crypto outlets turned that into a gain of 151 percent and spoke of a recovery for the Shiba Inu chain. O
Shibarium processed 2,438 transactions on October 9, after 970 the day before. Several crypto outlets turned that into a gain of 151 percent and spoke of a recovery for the Shiba Inu chain. One day later the same statistic shows 1,142 transactions. The recovery therefore held for exactly 24 hours.
This article takes the figures behind the story and checks the arithmetic. All network values come from our own query of the Shibariumscan API on the evening of October 11. The price of Shiba Inu stood at $0.00000549 at the same moment, 0.12 percent above the previous day and 5.58 percent down over seven days.
What actually happened on Shibarium: 5,711, then 970, then 2,438, then 1,142
The series of daily transactions gives a different picture from the snapshot of October 9. On October 6 Shibarium processed 5,711 transactions, the highest reading since the start of September. October 7 brought 1,323, October 8 brought 970, October 9 then 2,438 again and October 10 brought 1,142. The jump the 151 percent refers to starts from one of the weakest days of the month. Measured against the October 6 peak, the current level sits 80 percent lower.
The average of the past 31 days is 1,928 transactions a day, 59,776 in total. At 1,142, the most recent fully recorded day sits 40.8 percent below that mean. The low of the period was 794 transactions on September 20. Shibarium therefore moves in a band between roughly 800 and roughly 5,700 transactions a day, and inside that band a single day-on-day comparison says little.
Investors who bought in on October 9 because the chain was supposedly running again mistook a daily swing for a trend. With percentages quoted without a baseline, that is the most common trap: 151 percent sounds like a fresh start but here means the move from 970 to 2,438, to a level that one day later was back below the monthly average.
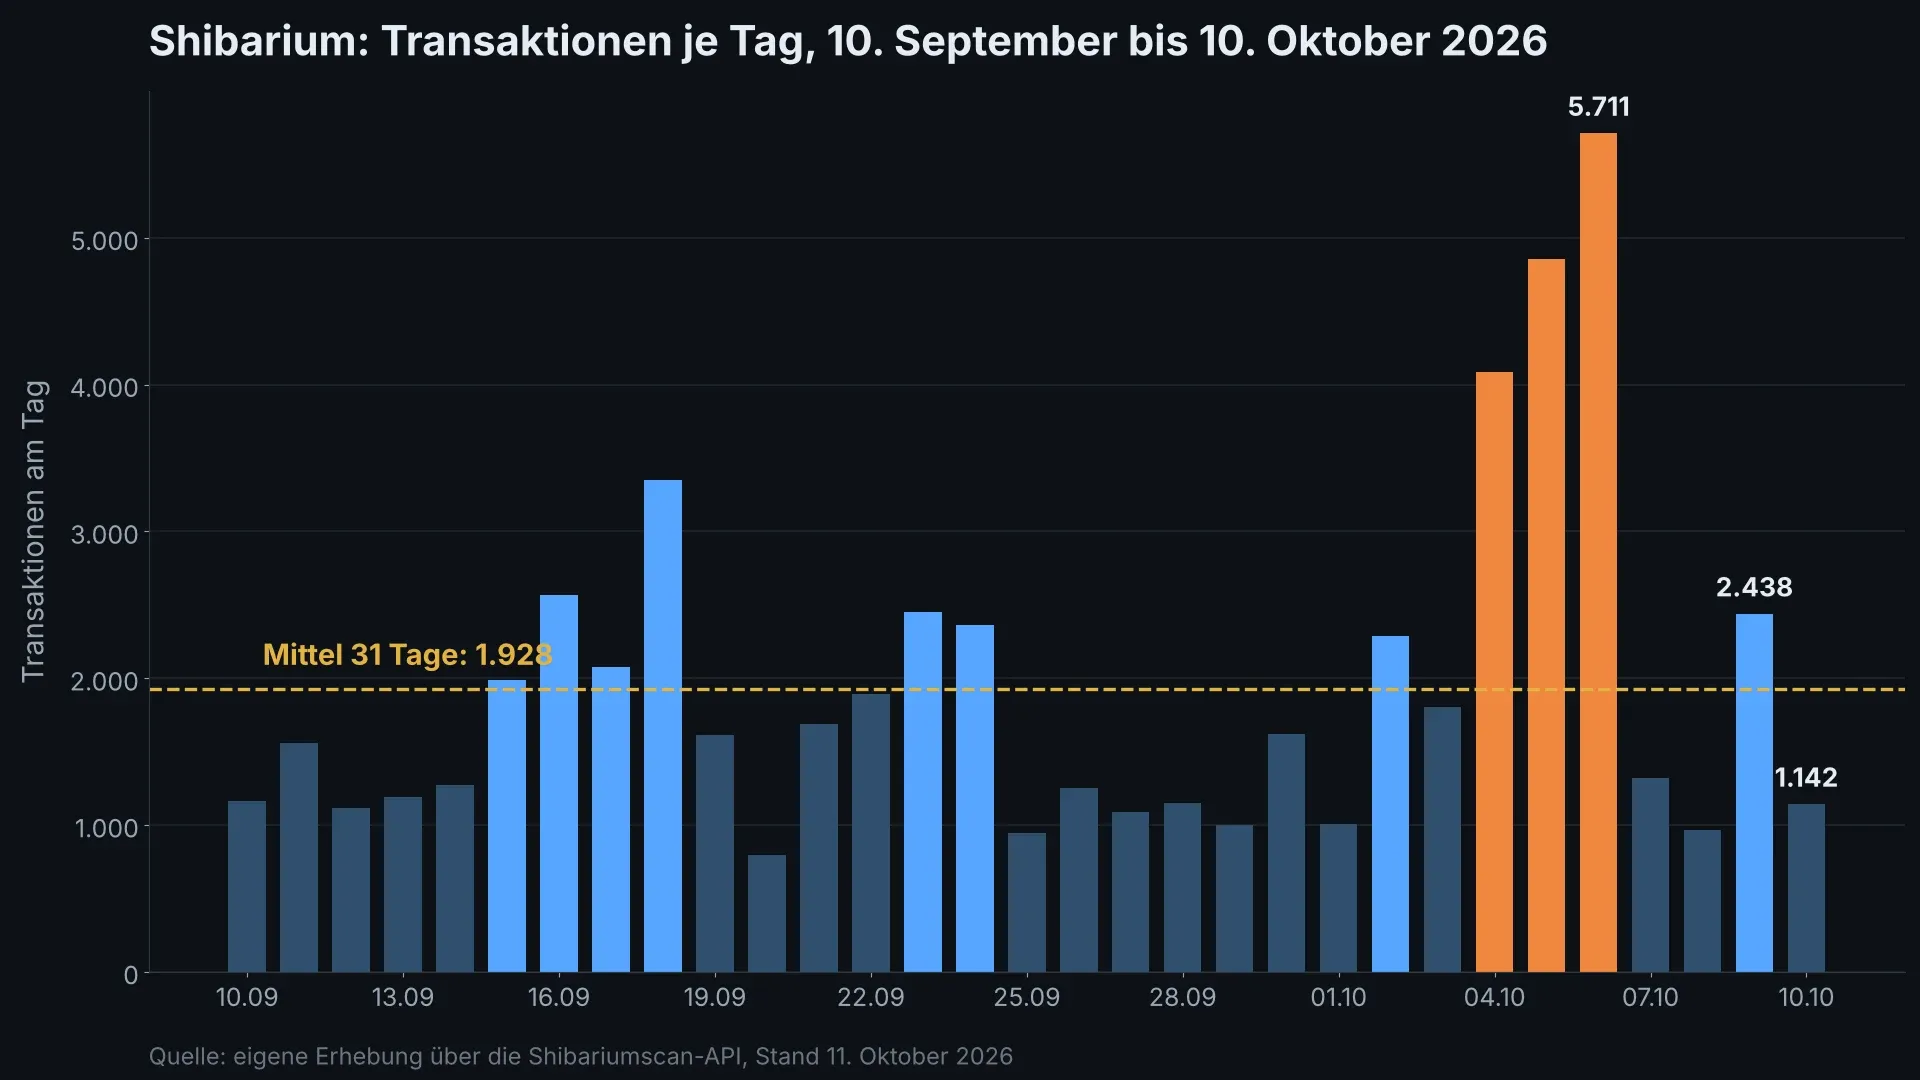
Our own data collection via the Shibariumscan API shows that the spike at the start of October was the exception, not the new normal.
Network utilisation of 0.027 percent: only every 15th block carries a transaction
The transaction count alone says nothing about how full a chain is. Network utilisation covers that, meaning the share of available block space actually taken up. Shibariumscan puts it at 0.026787 percent, or 0.027 percent rounded.
Block time makes it more tangible. Shibarium produces a block every 5.02 seconds on average, which comes to roughly 17,211 blocks in a day. Spread 1,142 transactions across those blocks and every 15th block carries a single transaction on average. The other 14 are empty. At the monthly mean of 1,928 transactions it would still be only every ninth block.
Empty blocks are no technical defect. A chain that produces blocks on a fixed cadence turns them out without demand as well, and Shibarium ran without interruption throughout. The blocks do show how much capacity goes unused, though, and they explain why the next figure looks the way it does.
A fee market without demand: slow, average and fast all sit at 0.03
Shibariumscan reports three fee tiers: slow, average and fast. On October 11 all three sit at 0.03 gwei in BONE, the chain's fee currency. One gwei is a billionth of a BONE unit.
That the three tiers are identical is the real finding. A fee market only forms once more transactions want into a block than will fit, and senders then push ahead of each other by paying more. Without that crush there is no premium, and whoever wants to get through quickly pays the same rate as someone content to wait.
That has two implications. A transfer on Shibarium currently costs next to nothing and is confirmed immediately. At the same time, the low rate is the sign that little is happening on this chain.
How Shibarium's throughput drives the SHIB burn
The link between chain activity and token supply is where the figures become interesting for investors. Shibarium is built so that part of the fees accruing on the chain flows into the burning of SHIB. Burning means tokens are sent to an address from which nobody can retrieve them, because no private key exists for it. The tokens remain visible on the blockchain but are permanently out of circulation.
On the day under review the chain consumed 166,869,016 units of gas. At a rate of 0.03 gwei that works out to fee income of roughly 0.005 BONE for the entire day. That is the pool feeding the fee-driven part of the burn. Waiting for Shibarium to tighten the supply of SHIB noticeably means waiting for a mechanism that lacks its basis at this throughput.
None of this is a charge against the technology. A layer-2 chain is built to make transactions cheap, and that is precisely what Shibarium does. The burn depends on the product of fee rate and volume, though, and both factors are currently small. Being cheap and financing a strong burn at the same time is possible for a chain only at high throughput.

The capacity is there and a fraction of it is used: the principle behind a network utilisation of 0.027 percent.
Since the Shibariumscan reindex on October 6: 80 percent fewer transactions
On October 6 we reported here that only 55 percent of Shibarium blocks were indexed in the explorer and that the displayed figures should therefore be read with care. That point has since been settled: the API now delivers a continuous series across 31 days without gaps, and the explorer counts 11,185,007 blocks and 749,707,890 transactions since the chain launched. The data situation has improved, then. The throughput has not.
October 6 was also the month's day with the most transactions. Of those 5,711, four days later 1,142 are left, a drop of 80 percent. Our article of October 10 dealt with the other side of the same coin, namely that the capital locked in Shibarium had fallen by 68 percent and that a single pool explained most of it. Less locked capital and fewer transactions belong together: where no capital sits, nothing gets swapped either.
On price the comparison comes out milder. In our article of October 6, SHIB stood at €0.00000514; on the evening of October 11 it is €0.00000491. That is 4.5 percent less in five days, while throughput on its own chain collapsed by 80 percent. The price does not follow the network one for one, and with a token whose trading takes place overwhelmingly on centralised exchanges, that is not to be expected either.
Very different burn figures circulate around SHIB, depending on which tracker happens to be measuring which period. You can work out the overall balance yourself with two publicly available figures, without having to trust any tracker.
The original supply of Shiba Inu stood at one quadrillion tokens, that is 1,000,000,000,000,000 units. As total supply, CoinGecko reports 589,495,745,532,498 SHIB on October 11. The difference of 410,504,254,467,502 tokens is the quantity burned since launch, and that is 41.05 percent of the original supply. Of that, 589,238,379,798,174 SHIB are in circulation; the remaining roughly 257 billion tokens are listed as non-circulating.
Those 41 percent sound like a lot and they are, except that they stem almost entirely from a single action in May 2021, when half the supply went to an address without a key. The running burn from chain operations, by contrast, moves in an order of magnitude that barely changes the total. Throwing both figures into one pot is the most common error in reporting on the subject, and it makes a one-off decision from five years ago look like a running supply squeeze.
SHIB at $0.00000549: daily range, monthly balance and the distance to the high
On the evening of October 11, SHIB is quoted at $0.00000549 or €0.00000491. The daily range ran from $0.00000537 to $0.00000553, a shade under three percent between low and high. Over 30 days there is a gain of 6.18 percent, over seven days a loss of 5.58 percent, over twelve months a loss of 44.74 percent. Market value stands at $3.24 billion, which means 37th place, and daily turnover at $52.1 million.
From the all-time high of $0.00008616 on October 27, 2021, SHIB is 93.6 percent away. The levels the current day provides are the daily low at $0.00000537 on the downside and the daily high at $0.00000553 on the upside. Both lie less than two percent from the current level, which explains the slight movement of the past 24 hours.
For a sense of scale: at €0.00000491 one euro buys roughly 203,700 SHIB, so a hundred euros buys a good 20.3 million tokens. The many zeros are a question of unit count and say nothing about whether the token is expensively or cheaply valued. Market value counts for that, and at $3.24 billion SHIB sits clearly behind Dogecoin, which comes to around $13.6 billion on the same evening.
Holding period and allowance: what to check before selling SHIB
Anyone holding SHIB as private assets in Germany falls under the rules for private disposals set out in section 23 of the German Income Tax Act. The gain from a sale is tax-free if more than a year lies between purchase and sale. Within the year it is taxable at the personal income tax rate as soon as the sum of all private disposal gains in a calendar year reaches 1,000 euros.
Three points are regularly overlooked here. The limit is an exemption threshold, not an allowance: at 999 euros of gain you pay nothing, at 1,001 euros the entire amount is taxable. The calculation also runs across all private disposals of a year together, gold or collectibles included. And the burning of other people's tokens changes nothing in your own holding, while a swap between two tokens is very much a taxable event.
In practice that means looking at the purchase date of each individual tranche before you unwind a position, rather than at the average. Holdings from the start of 2025 are past the one-year mark and sell tax-free. A tranche bought in the summer of 2026 is still inside the taxable window. A tax tool with a portfolio tracker handles this more reliably than a spreadsheet kept by hand, because it carries the order of acquisitions with it.
BONE staking on Shibarium: the yield hangs on the chain's throughput
On Shibarium, tokens can be deposited to share in the chain's fees. The calculation further up shows what that share currently amounts to. With fee income of roughly 0.005 BONE a day, little remains on paper once it is spread across all depositors. On a chain like this, an advertised annual yield is no promise but an extrapolation from a period when more was going on.
For tax there is the added point that income from staking and lending does not fall under the one-year rule but counts as other income under section 22 number 3 of the German Income Tax Act. A separate and considerably lower exemption threshold of 256 euros a year applies to it. Yield drawn on several platforms is added together. A look at a comparison of staking providers pays off above all on the question of who documents the income traceably, because reporting it is down to you.
Our assessment: the chain works, the burn stays small
In the editorial view, the story of the 151 percent recovery is an artefact of arithmetic and not a finding. The evidence stands further up: the jump starts from the month's second-weakest day, 53 percent of it was given back one day later, and against the monthly average of 1,928 transactions the current level lags by 40.8 percent. Claiming a turnaround takes several weeks above that average, not one day.
Against that stands the point that the chain runs technically without fault and that data quality has improved since the reindex. The infrastructure is in place, then; the demand is missing. What that means for the price is open: SHIB has added 6.18 percent over 30 days although throughput on its own chain collapsed. The price is currently carried by the general market, not by Shibarium. No recommendation to buy or sell follows from that, and with a memecoin a total loss remains possible at any time.
Shibarium: below 1,900 transactions a day the burn stays small
The threshold against which the coming weeks can be measured is the monthly average of 1,928 transactions a day. As long as Shibarium stays below it, fee income and with it the fee-driven burn stay in the order of magnitude set out above.
- Look up the figure yourself. The daily series is public at shibariumscan.io in the statistics section. No tracker and no newsletter are needed for it, and you see immediately whether a reported percentage jump was calculated from a weak or a strong previous day.
- Record the purchase date of every tranche. Tax turns on the one-year rule, not on the average price. If you hold SHIB through an exchange, export the transaction list now rather than in March. Which venues deliver that export cleanly is set out in the comparison of crypto exchanges.
- Hold yield promises against throughput. An advertised annual yield on Shibarium staking presupposes fee income. Set it against the roughly 0.005 BONE that accrued in total on the day under review before you tie up capital.
(As of October 11, 2026. This article is not investment advice. Prices and fee structures change; check the terms with the provider before you buy.)