SHIB remains inside a descending channel, with its nine-day moving average acting as immediate resistance. The 9-day average price of SHIB is below and a falling trendline is setting up a dow
- SHIB remains inside a descending channel, with its nine-day moving average acting as immediate resistance.
- The 9-day average price of SHIB is below and a falling trendline is setting up a downtrend bias on the short-term chart.
- The next downside levels are $0.00000460 and $0.00000420, while $0.00000400 remains deeper support if selling continues.
Shiba Inu is set for a major test as a new support range appears near the price and daily chart highs are declining, with poor momentum readings prevailing.
SHIB Remains Trapped Inside a Descending Channel
U.Today recently reported that SHIB remained below major resistance, citing rising sell volume and weakening momentum.Its immediate downside targets were seen as $0.00000460 and $0.00000420. It also placed $0.00000400 as deeper support if sellers maintain control.
https://twitter.com/Utoday_en/status/2116365424661037209?a=2HqeoX2kH0EGsQs0jaQ&s=20
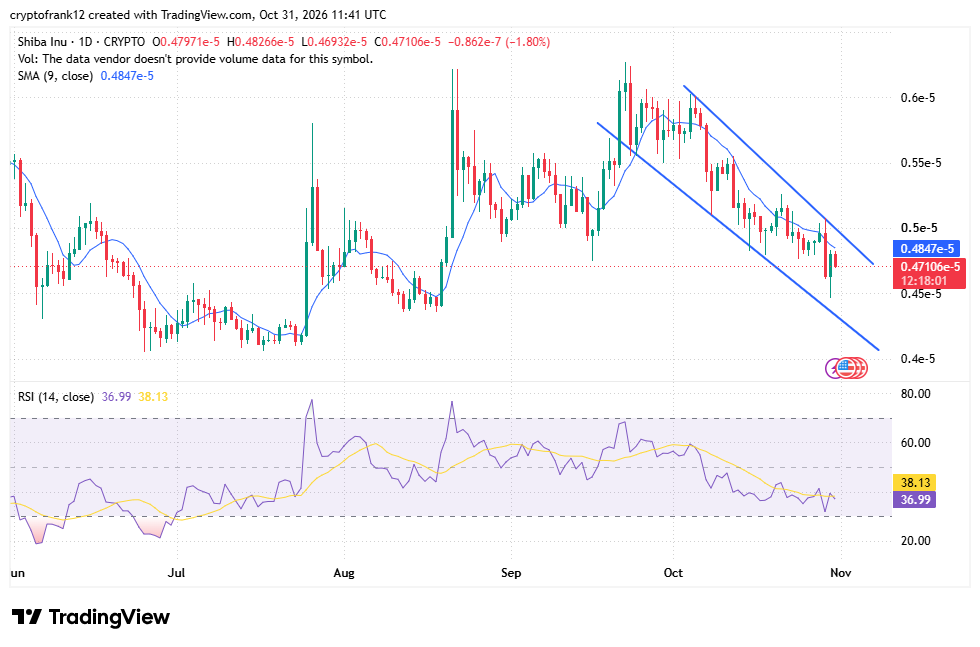
The TradingView chart supports a cautious reading of the current price structure. SHIB as of the time of writing traded around $0.0000047015, down 1.99%. Its candles remain inside a descending channel that has shaped October's decline.
Source:
Tradingview
The channel's upper boundary connects a series of lower highs. Meanwhile, its lower boundary follows progressively weaker price lows. This arrangement shows sellers repeatedly limiting recovery attempts.
The pattern developed after SHIB reached above $0.0000060 in early October. Subsequent rebounds failed to regain that earlier trading range. Each rejection added to the sequence of lower highs now defining the chart.
Moving Average and RSI Keep Buyers Under Pressure
The nine-day simple moving average stands near $0.0000048459. SHIB trades beneath it, leaving the average as immediate resistance. Buyers would need to reclaim this level before challenging the channel's upper boundary.
The gap between price and the moving average remains relatively narrow. However, repeated failures below the average would reinforce the current downward structure. A daily close above it could provide the first indication of improving short-term demand.
Momentum readings offer little evidence of a completed reversal. The Relative Strength Index (RSI) is at 36.76 and the signal average (SMA) is 38.12. Both readings are below 50, the neutral reading.
The RSI never dropped below the oversold level of 30. So, we are not getting a traditional oversold reading on the indicator yet. Additional weakness is possible as long as sellers dominate price action.

Support Levels Define the Next SHIB Move
The first downside reference sits around $0.00000460. This level matches the nearest target in U.Today's supplied outlook. A sustained move beneath it could bring the lower $0.00000420 area into view.
The chart also shows recent trading around $0.0000045. A daily close below that region would weaken the immediate support structure. Traders may then watch whether price approaches the channel's lower boundary.
That boundary currently projects towards approximately $0.0000041. Its position will change as additional daily candles form. The projected area will be used as a guide, not a hard-coded price.
If selling volume picks up, the lower resistance level at $0.00000400 is still relevant. A sustained break beneath it would put the supplied support outlook under pressure. The available chart does not establish where stronger demand might emerge afterwards.
A bullish response would require SHIB to regain $0.00000485. Buyers would then need to challenge the descending channel's upper edge. Until those levels are recovered, rallies may struggle to develop into lasting gains.
The chart's volume panel also carries an important limitation. TradingView states that the data vendor does not provide volume for this symbol. Consequently, the recent decline cannot be checked against reliable volume readings.
For now, SHIB remains below its short-term average, with RSI signalling weak momentum. The $0.00000460 and $0.00000420 levels provide the next downside references. A recovery above the moving average and channel resistance would be needed to alter the current bearish structure.
The post Shiba Inu Faces Further Losses Below Key Resistance appears on Coin Futura. Visit our website to read more interesting articles about cryptocurrency, blockchain technology, and digital assets.