SHIB maintains a sequence of lower highs and lows as selling pressure continues across the four-hour chart. The MACD remains deeply negative, while RSI approaches oversold territory without c
- SHIB maintains a sequence of lower highs and lows as selling pressure continues across the four-hour chart.
- The MACD remains deeply negative, while RSI approaches oversold territory without confirming a bullish reversal in momentum.
- A defence near 0.00000385–0.00000390 may support recovery, while failure could expose lower technical support levels.
Shiba Inu remains under pressure after a steep decline, while its latest four-hour rebound leaves traders watching momentum, volume and nearby support levels before assessing a possible trend change.
SHIB Extends Its Decline Across Multiple Timeframes
BarksAndBrews recently shared an outlook featuring Ali Charts' bearish assessment of SHIB's technical structure. The analyst identified $0.0000041 as critical support on the three-day descending channel. A correction of approximately 34% has brought the token towards this important boundary.
https://twitter.com/shibarmyio/status/2121718776202953209?a=ibLcr4KOWvf88-cRfFY&s=20
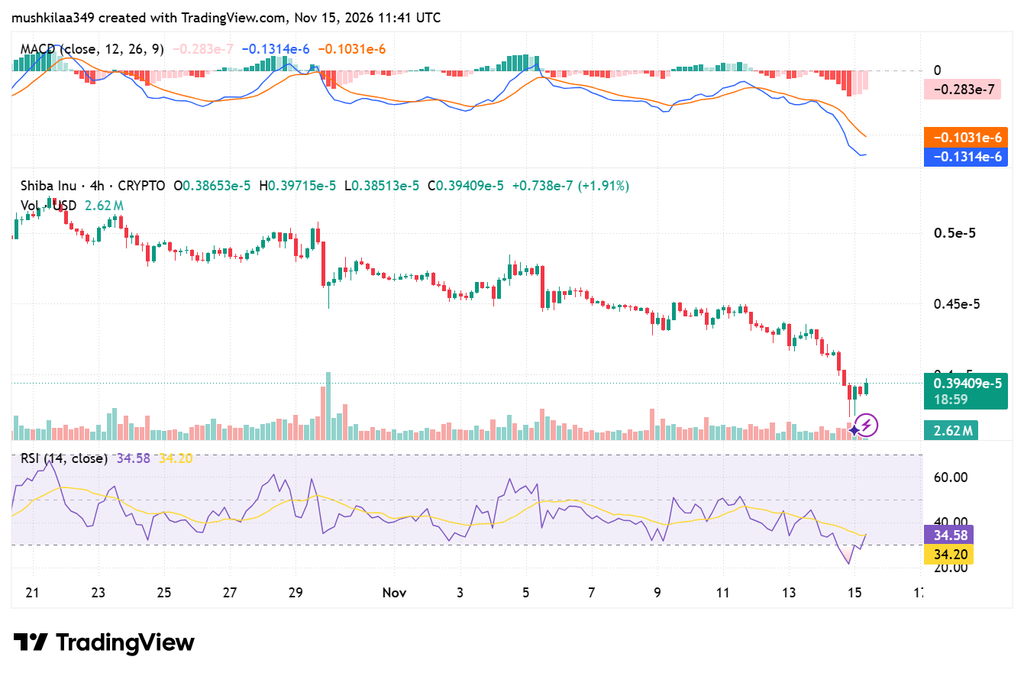
However, the four-hour chart presents an even weaker picture of recent trading activity. The price has declined steadily from above $0.0000050 around October 21. Several recovery attempts followed, particularly around October 29 and November 5. Nevertheless, sellers repeatedly returned, preventing sustained progress towards higher trading levels.
Source:
Tradingview
The latest selling accelerated around November 14, pushing SHIB beneath $0.0000045. The chart records a closing price of approximately $0.0000039191. This represents a 1.34% recovery during the latest four-hour candle. However, the modest improvement has not reversed the broader downward structure.
The distinction between these timeframes remains important when assessing current support. The three-day analysis identifies $0.0000041 as a major decision level. Meanwhile, the four-hour chart shows trading around 0.00000385–0.00000390. This places immediate attention on whether buyers can establish stability.
MACD Signals Persistent Selling Pressure
The MACD indicator reinforces the bearish picture emerging from recent price movements. Its blue line has fallen sharply beneath the orange signal line. Both lines remain below zero, reflecting sustained negative momentum. Their widening separation also indicates increasing downward pressure.
Additionally, the histogram displays increasingly negative readings during the latest decline. This development suggests that sellers have strengthened their position recently. A contracting histogram would provide early evidence of weakening bearish momentum. However, the current readings have yet to establish that improvement.
The RSI offers a slightly different perspective on market conditions. Its reading stands at approximately 32.77, approaching the conventional oversold threshold. The indicator recently dipped towards 20 before turning upwards. This movement suggests that downward momentum could be approaching exhaustion.
Nevertheless, the RSI remains below its yellow average at approximately 34.07. Consequently, the indicator has not confirmed a convincing bullish shift. A recovery above this average could improve the short-term momentum picture. Until then, the broader technical pressure remains evident.
Support Levels and Recovery Conditions Remain Critical
Trading volume provides additional information about the latest price movement. The breakdown towards $0.00000385 coincided with noticeable volume expansion. However, the subsequent recovery has not demonstrated comparable buying participation. Stronger green-candle volume would provide better evidence of renewed demand.
The immediate four-hour support region sits around 0.00000385–0.00000390. Holding this area could allow SHIB to consolidate after its latest decline. Conversely, losing this region could expose the token to further weakness. The next recovery objective would involve reclaiming $0.0000040.
Beyond that level, $0.0000045 represents another important area for buyers. A sustained move towards this region would indicate improving short-term conditions. However, the three-day analysis identifies $0.0000051 as its broader recovery target. Reaching that level would require stronger demand and improved momentum.
The bearish scenario remains defined by the previously identified downside targets. Ali Charts places potential support around $0.0000033 following a decisive breakdown. Further weakness could bring $0.0000027 into focus. That level represents approximately another 30% decline from $0.0000041.
Market sentiment also presents difficulties for a sustained recovery. ShibArmy Terminal reports an extreme fear reading of 20. Meanwhile, SHIB burn activity has fallen 78% against its seven-day average. These figures accompany the weakening technical conditions currently visible across both timeframes.