SHIB burned over 338,000 tokens in one day, but the price still fell 3.63% and the rally has stalled. This Shiba Inu price prediction looks at whether $SHIB holds above $0.000005490 and tries
SHIB burned over 338,000 tokens in one day, but the price still fell 3.63% and the rally has stalled.
This Shiba Inu price prediction looks at whether $SHIB holds above $0.000005490 and tries to break the $0.000006263 level again.
Shiba Inu News Today: 338,051 SHIB Burned in 24 Hours
Shibburn, a tracker that follows SHIB burns, reported that 338,051 $SHIB were burned in the past 24 hours. A burn means tokens are sent to a wallet that no one can use, so they leave the supply for good.
Less supply can help price over time, but a burn this size is small next to $SHIB's very large supply.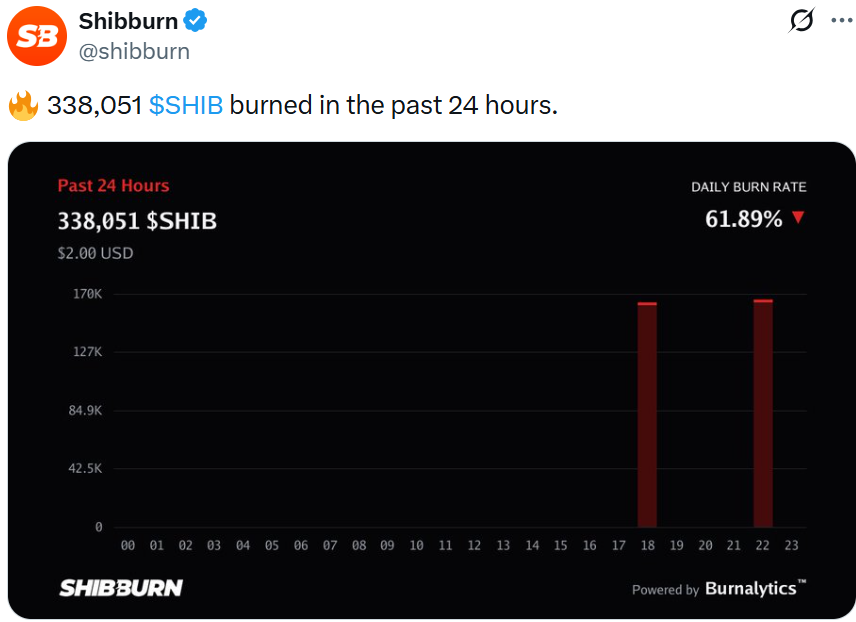
Source: Data From X
CoinGabbar could not independently verify the number, as no transaction link was shown in the post.
Shiba Inu News: Rally Stalls as Exchange Reserves Rise
A crypto news post said the SHIB rally has stalled as exchange reserves surge. Exchange reserves are the coins held on trading platforms. When they rise, more coins may be ready to sell, which can cap the price.
The post's headline also mentioned an 88 trillion threshold, but the part shown did not explain what that number measures. CoinGabbar could not independently verify the reserve data.
SHIB Price Today: Technical Analysis
The chart shows two earlier channels, one in July and August and one in August and September. Each time, the price slid down inside the channel and then broke out higher.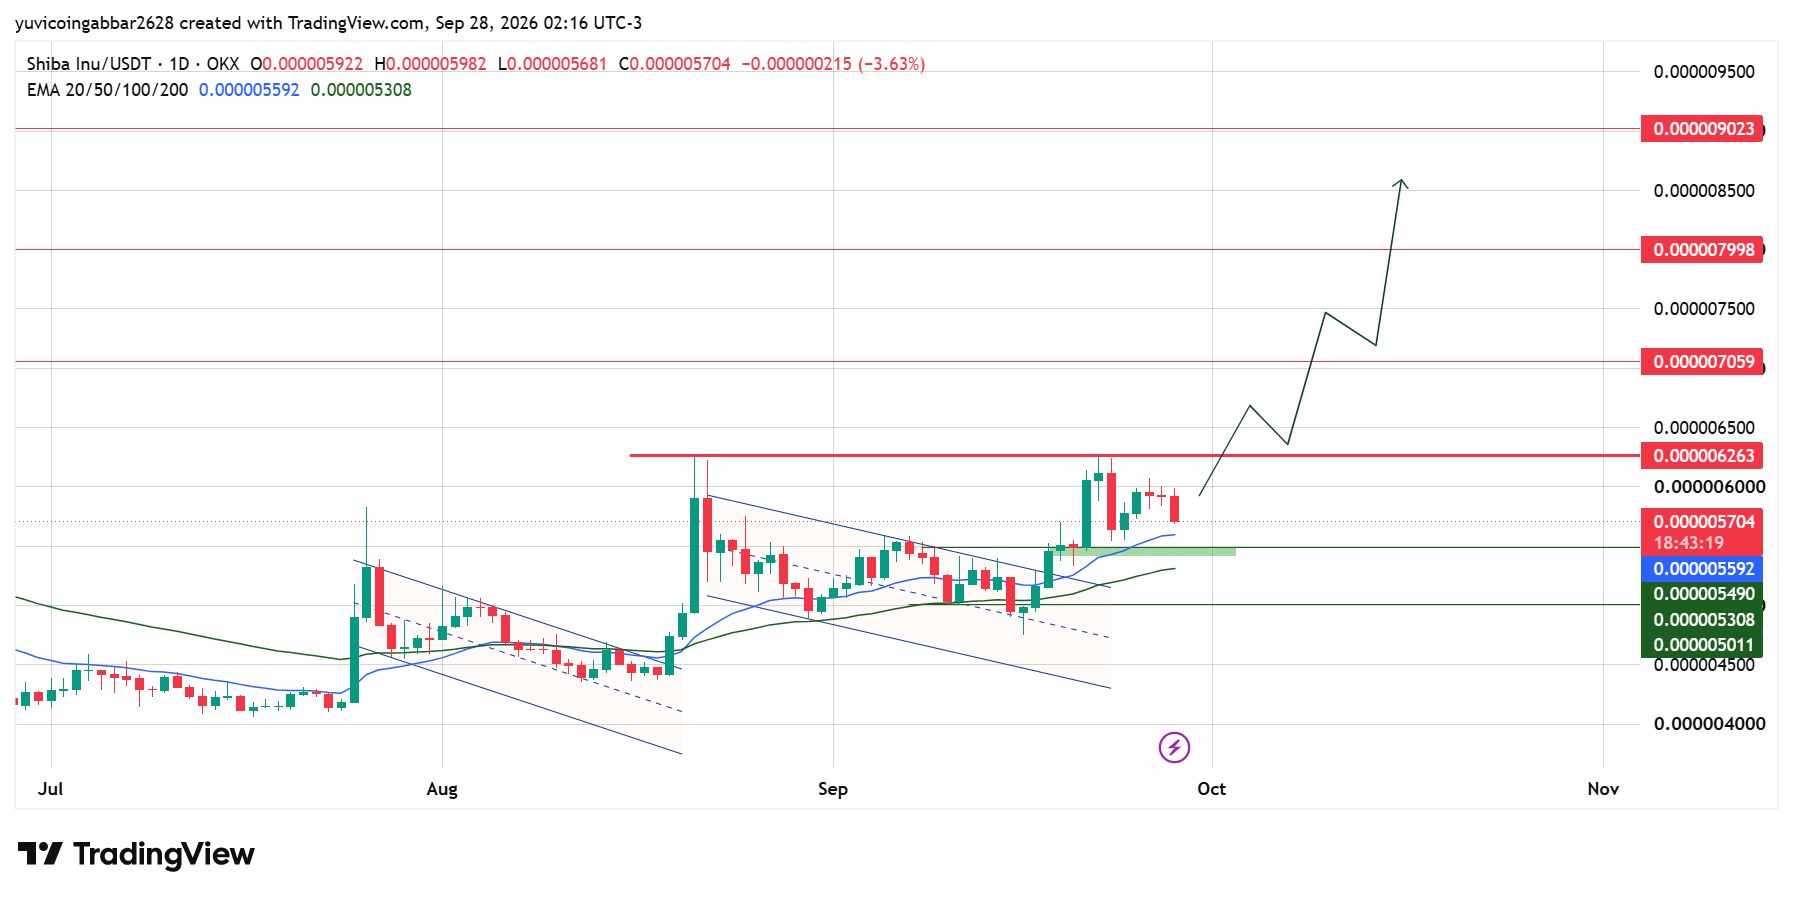
The second breakout came in mid-September, and SHIB jumped to a high near $0.000006263 around September 21.
Sellers stopped that move at $0.000006263, and the price has been sliding. The Shiba Inu price today is down 3.63% at $0.000005704, and the last few days show lower highs.
That is a normal pullback after a sharp jump, but it also matches the news about stalled buying.
Two EMAs sit just below. The 20 EMA is at $0.000005592, and the 50 EMA is at $0.000005308. Price is above both, so the bigger trend is still up.
The green zone near $0.0000055 to $0.0000056 also lines up with the old breakout area, so it is the first place buyers may return.
SHIB Outlook key Levels
Level Type
Price
Resistance 4
$0.000009023
Resistance 3
$0.000007998
Resistance 2
$0.000007059
Resistance 1 (nearest)
$0.000006263
Immediate Price Reference
$0.000005704
First Confirmed Support
$0.000005490
EMA Support Zone
$0.000005592 to $0.000005308
Deeper Support
$0.000005011
Shiba Inu Forecast
Bull case: If the price holds above $0.000005490 and turns up from the EMA zone, $SHIB could retest $0.000006263. A close above that level would open the way to $0.000007059. Steady burns add a small extra reason for buyers to stay.
Bear case: Rising exchange reserves and lower highs point to selling pressure. A close below $0.000005490, then below the 50 EMA at $0.000005308, would suggest the breakout is failing and put $0.000005011 in play.
Shiba Inu Price Prediction: Can Shiba Inu Reach $0.000009023?
$0.000009023 is the highest level marked on the chart. To reach it, $SHIB must first break $0.000006263, then $0.000007059 and $0.000007998.
That is a long climb in several steps, and it needs the pullback to end first.
Shiba Inu Price Prediction 2026: Expert View
According to CoinGabbar analysts, the chart is still in an uptrend, but the news is mixed. Burns are steady, while rising exchange reserves suggest some holders may be ready to sell.
The $0.000005490 level is the one to watch, because a hold there keeps the breakout alive.
Disclaimer
This piece is for informational purposes only and isn't financial advice. The levels and scenarios above are based on technical chart analysis and publicly available data at the time of writing. Crypto markets can move sharply within hours, so past patterns don't guarantee future outcomes. Do your own research and consider your risk tolerance before acting on any level discussed here.