This Shiba Inu price prediction starts with the basics: $SHIB, the meme coin that exploded onto the scene in 2020 and has since built out its own Shibarium ecosystem, is currently trading aro
This Shiba Inu price prediction starts with the basics: $SHIB, the meme coin that exploded onto the scene in 2020 and has since built out its own Shibarium ecosystem, is currently trading around$0.00000513 today, up modestly on the day.
It remains one of the most traded meme assets by market cap, and traders are watching closely to see where this move goes next.
Live Market Data
Metric
Value
Price
$0.00000513
24h Change
+2.2%
24h Range
$0.00000500 - $0.00000514
Market Cap
$3.025B
Fully Diluted Valuation
$3.026B
24h Trading Volume
$62.239M
Circulating Supply
589.239T
Total Supply
589.496T
Source: $SHIB market cap data taken from CoinGecko, data as of Sep 01, 2026. Figures may vary slightly across other tracking websites.
Exchange Volume
$SHIB futures activity is fairly spread out across venues rather than concentrated on one exchange. LBank currently leads with $13.17M in volume, followed by OKX at $10.59M. 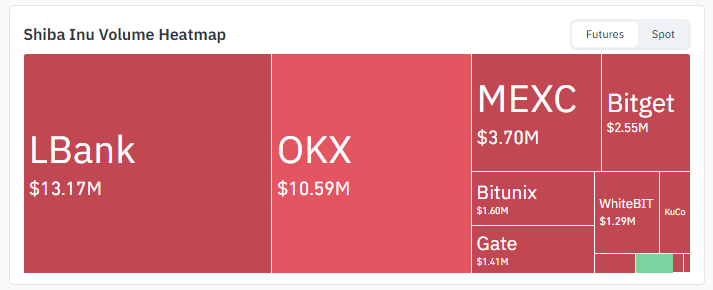
Source: Volume Heatmap Data Taken From Coinglass.
MEXC ($3.70M), Bitget ($2.55M), Bitunix ($1.60M), Gate ($1.41M), and WhiteBIT ($1.29M) round out the rest, alongside smaller contributions from KuCoin and others.
That kind of distribution generally points to broad-based participation rather than one platform driving the tape.
Liquidation Snapshot
Timeframe
Total Liquidated
Longs
Shorts
1h
$427.69
$0.01
$427.69
4h
$5.09K
$2.81
$5.09K
12h
$7.50K
$838.98
$6.66K
24h
$41.74K
$1.84K
$39.90K
Source: Liquidation Data Taken From Coinglass.
Short sellers have taken the brunt of the pain across every window, which lines up with the wedge grinding upward and squeezing bearish bets along the way.
Shiba Inu News Today
Beyond the chart, a Shiba Inu price prediction wouldn't be complete without the latest headline. Fresh buzz around SHIB is coming from Japan rather than the charts.
Rakuten Wallet has lined up a Shiba Inu-themed event in Fukuoka on September 12, where its Securities Investment Academy will host a presentation from a senior analyst. 
Source: Data Taken From @BSCNews, X Account.
Attendees who show proof of SHIB holdings on the platform can enter a giveaway for physical souvenir coins, though the exchange has been clear these metal collectibles carry no actual technical link to the Shiba Inu blockchain itself.
It's a marketing push more than a fundamental catalyst, but exchange-level engagement campaigns like this can still nudge retail attention and, by extension, short-term volume.
Key Takeaways
SHIB is trading around $0.00000513, hovering right beneath the upper boundary of a falling wedge on the daily chart.
A volume-backed breakout could send the price toward the 200 EMA resistance at $0.00000570, then $0.00000670 and $0.00000725.
Rejection at that first wall, paired with active sellers, risks a slide back toward $0.00000473 and lower.
RSI sits at 53.34, a fairly neutral reading that leaves room to run either way.
24-hour liquidations lean short, with $39.90K in short positions wiped out versus barely $1.84K in longs.
Technical Analysis of $SHIB
Channel Breaks Set the Tone
Zoom out on the daily $SHIB chart, and a pattern repeats itself. Price first got squeezed inside a descending channel, ground sideways for weeks, then finally snapped the upper boundary and ripped higher in one sharp candle. 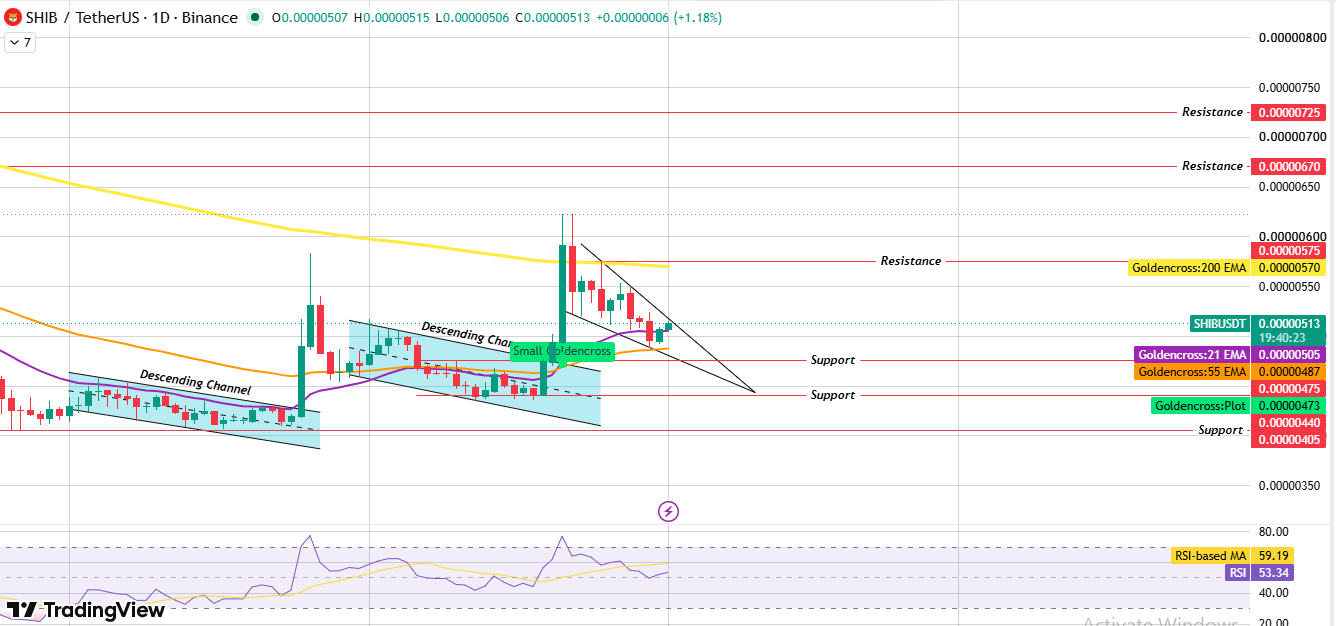
Source: Chart Taken From TradingView.
That's not a one-off either. The exact same setup played out a second time: another descending channel, another clean break above resistance, another burst of buying that caught short sellers off guard.
Two structurally similar moves back to back tend to tell you something about where demand keeps stepping in.
Falling Wedge Takes Shape
After that second rally cooled off, SHIB began carving out a falling wedge, a pattern where both the highs and the lows are sloping down, but the lows are falling slower, squeezing price into a tightening range.
Right now the price sits just under the upper boundary of that wedge, effectively knocking on the door.
Falling wedges after an uptrend are typically read as continuation setups, so the market is essentially asking whether buyers have enough left in the tank to punch through.
What Momentum Is Saying
RSI reads 53.34, comfortably in neutral territory, while the RSI-based moving average sits higher at 59.19.
Neither extreme overbought nor oversold, which fits the sideways coiling we're seeing on price.
It also means there's no immediate momentum exhaustion warning traders off a breakout attempt.
The Breakout Path
Should SHIB clear the wedge's upper trendline on solid volume, the $0.00000570 mark, where the 200 EMA sits, becomes the first real test.
Clearing that opens the door toward $0.00000670 and eventually $0.00000725, both prior resistance shelves from earlier in the chart.
The Rejection Path
If sellers show up at that first resistance and price gets turned away, the wedge's support cushion around $0.00000487 to $0.00000473 is the first line of defense.
A harder breakdown risks a retest of $0.00000440 and $0.00000405 further down.
EMA Levels
EMA
Level
21 EMA
$0.00000505
55 EMA
$0.00000487
200 EMA
$0.00000570
Goldencross Plot
$0.00000473
Support & Resistance Levels
Type
Level
Resistance 3
$0.00000725
Resistance 2
$0.00000670
Resistance 1
$0.00000570
Support 1
$0.00000475
Support 2
$0.00000440
Support 3
$0.00000405
Bull, Base & Bear Case
Scenario
Target Levels
Trigger
Invalidation
Bull Case
$0.00000570 → $0.00000670 → $0.00000725
Wedge breakout with rising volume
Close back below the lower wedge trendline.
Base Case
$0.00000473 - $0.00000570 range
Price stays boxed inside the wedge, chopping between EMAs.
Sustained break of either boundary
Bear Case
$0.00000487 → $0.00000473 → $0.00000440 → $0.00000405
Rejection at 200 EMA with seller aggression
Reclaim of $0.00000570 on volume
Note: All levels are chart-derived from the daily SHIB/USDT timeframe. This is not financial advice.
Expert Opinion
As per Coingabbar market analyst commentary circulating around this news, it leans toward viewing it as a sentiment booster rather than a game-changer.
The read among observers is that partnerships and community-facing events from established exchanges tend to widen SHIB's retail visibility in new regions, even when the giveaway itself is symbolic.
Whether that translates into sustained buying pressure is a separate question, and most chart watchers are still treating the wedge breakout, not the Japan event, as the level that actually decides SHIB's next real move.
Glossary
Descending Channel: A price structure where both highs and lows trend lower inside two roughly parallel lines, often resolved by a breakout in either direction.
Falling Wedge:Two converging trendlines that both slope downward, with the lower line falling slower than the upper one; frequently seen as a bullish continuation or reversal setup depending on prior trend.
EMA (Exponential Moving Average): A moving average that leans more weight on recent price action, making it quicker to react to shifts than a simple average.
RSI (Relative Strength Index):An oscillator ranging from 0 to 100 that gauges how fast and how far price has moved, commonly used to flag overbought or oversold conditions.
Support: A price zone where historical buying interest has been strong enough to slow or reverse a decline.
Resistance:A price zone where selling pressure has previously capped upward moves.
Liquidation: The forced closing of a leveraged position when losses erode the trader's margin below the required maintenance level.
Market Capitalization: Circulating supply of a token multiplied by its current price, used to gauge overall network value.
Methodology
Price levels and chart patterns referenced in this Shiba Inu Price Prediction are drawn directly from the SHIB/USDT daily chart on TradingView.
Liquidation and exchange volume data are sourced from Coinglass. All support, resistance, and EMA levels reflect the chart at the time of writing and are subject to change as new candles form.
No price targets in this piece extend beyond what is directly supported by the visible chart structure.
Disclaimer: This article is for informational purposes only and does not constitute financial, investment, or trading advice. Cryptocurrency markets, including Shiba Inu, are highly volatile and speculative. Prices can move sharply in either direction. Always do your own research and consult a qualified financial advisor before making investment decisions.