$SHIB currently sits at $0.00000465, barely moved after a small bounce. Anyone typing "shiba inu price prediction" into Google today really just wants to know one thing: is this the calm befo
$SHIB currently sits at $0.00000465, barely moved after a small bounce. Anyone typing "shiba inu price prediction" into Google today really just wants to know one thing: is this the calm before a move?
Because right now, the price is boxed into a tight range and hasn't picked a direction. Once it does, the next few sessions will probably follow that lead.
Worth noting, too, burn activity spiked hard on the last day, so supply-watchers have something extra to chew on alongside the usual chart talk.
Live SHIB Price Data
Shiba Inu is currently trading at $0.00000465, up close to 1% for the day.
Not much drama in the 24-hour range either; the price has stuck between roughly $0.0000046 and $0.0000047 the whole time. Market cap comes in around $2.74 billion.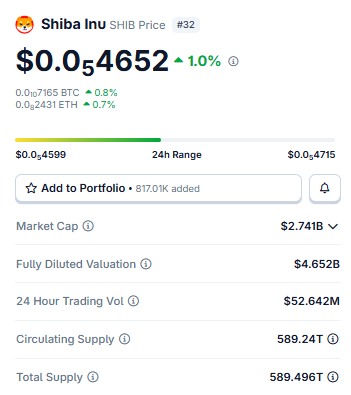
Source: $SHIB market cap data taken from Coingecko, data as of Aug 10, 2026. Figures may vary slightly across other tracking websites.
Fully diluted valuation runs higher, near $4.65 billion, thanks to SHIB's enormous total supply of almost 589.5 trillion tokens. Daily volume landed close to $52.6 million.
TradingView data shows price action has genuinely cooled off compared to earlier volatility, and honestly, that's the whole reason traders are watching so closely right now. Quiet periods tend to precede the loud ones.
Liquidation Data and Burn Activity
Longs have been taking the beating lately. Over the past 24 hours, total liquidations hit $45.16K, split $26.36K long versus $18.81K short. 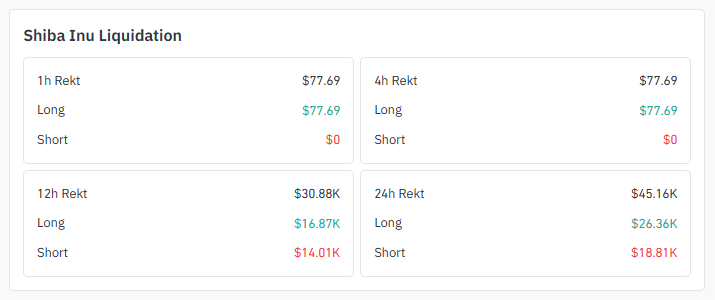
Source: Liquidation Data Taken From Coinglass.
Same story in the 12-hour window: $30.88K total, long again on the losing end.
Zoom into the 1-hour and 4-hour windows, and there's barely any action at all, just $77.69, entirely from longs, nothing close to a cascade yet.
Burn activity, though, that's where it gets interesting. Over 8.1 million SHIB got burned in a single day, and the daily burn rate itself jumped more than 161.99%. 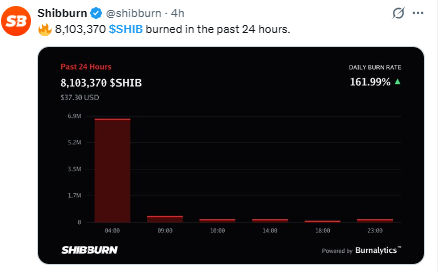
Source: Data Taken From @shibburn, X Account.
Does that pace hold? Hard to say. But if it does, it's one more variable feeding into the longer-term shiba inu price prediction picture, since heavier burning chips away at circulating supply over time.
Volume Heatmap Data of Shiba Inu
Volume-wise, OKX is running the show with about $9.02 million, LBank is close behind at $6.26 million, and then MEXC is at $5.54 million. 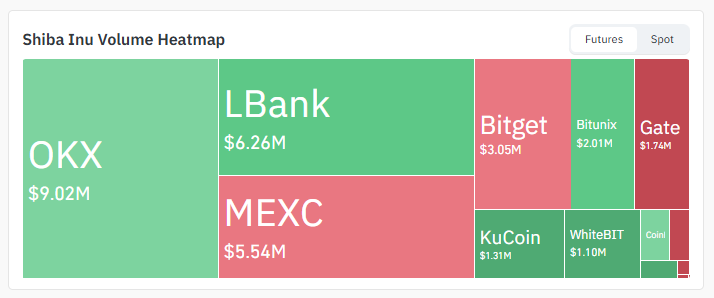
Source: Volume Heatmap Data Taken From Coinglass.
Smaller pockets of volume are scattered across Bitget, Bitunix, Gate, KuCoin, and WhiteBIT too.
Key Takeaways
Sitting near $0.0000046, up roughly 1% on the day, nothing dramatic
Overhead: two resistance walls. Below: two support floors. Classic squeeze setup
8.1 million+ SHIB burned in 24 hours, and the burn rate itself jumped over 161%
Longs got hit harder than shorts on liquidations, both in the 12h and 24h windows
Most of the futures action right now is running through OKX and LBank
Technical Analysis: What The Charts Are Saying
Hourly Chart Analysis for Shiba Inu Price Prediction
Boxed in $SHIB has been consolidating roughly between $0.0000046 and $0.0000047 for hours now. 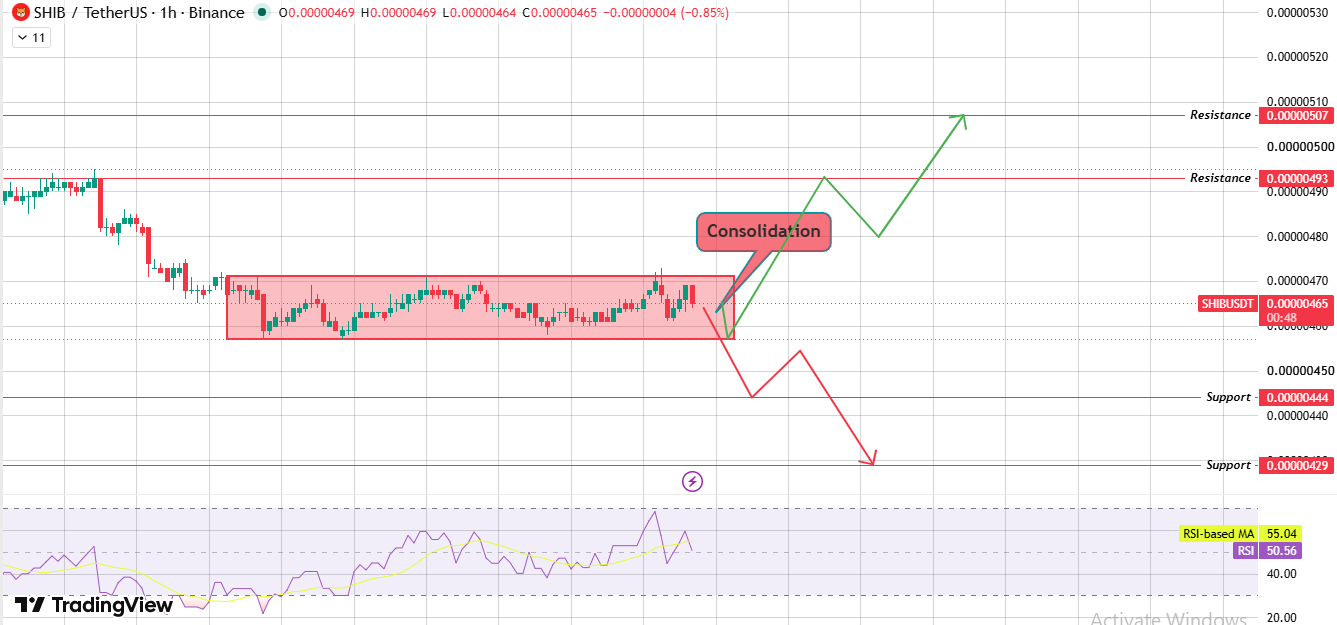
Source: Chart Taken From TradingView.
Break above the top of that box, and resistance at $0.00000493 comes into play, with $0.00000507 sitting right behind it.
Break below instead? Support at $0.00000444 is the first stop, then $0.00000429 further down. RSI reads 50.56, dead neutral, which checks out given how flat things have been.
4-Hour Chart Analysis for Shiba Inu Price Prediction
This one's more telling. Price is squeezed inside a descending triangle, and it's sitting almost exactly at the apex, meaning a resolution is coming soon whether traders like it or not. 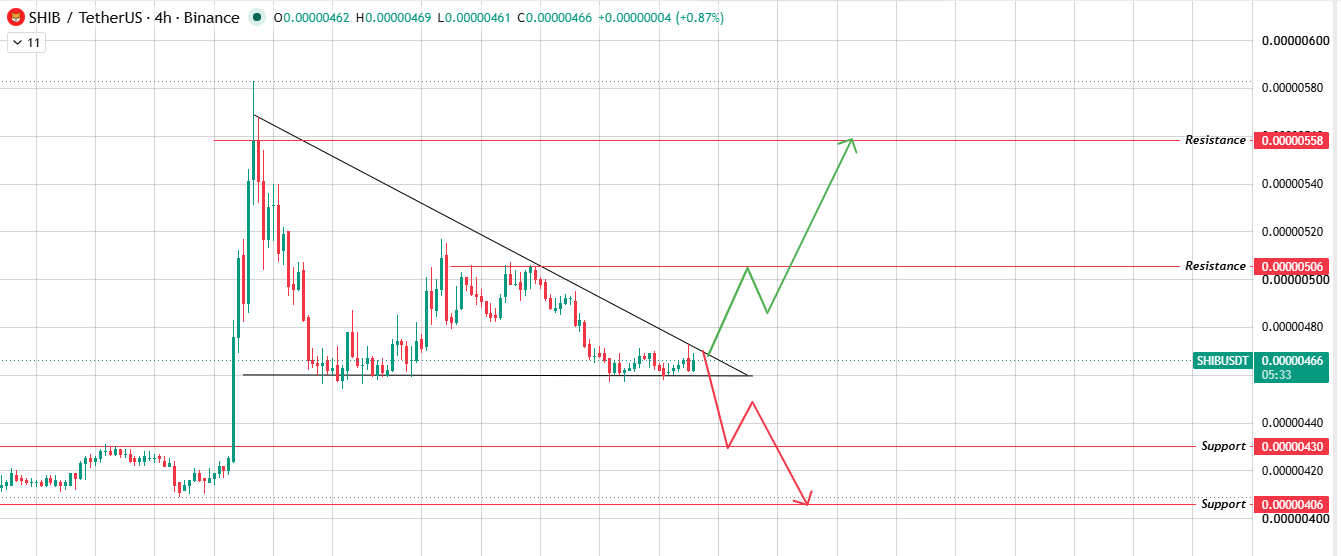
Source: Chart Taken From TradingView.
Break the upper trendline, and the shiba inu price prediction flips bullish fast, with $0.00000506 and then $0.00000558 as targets.
Break support instead, and $0.00000430 gives way first, followed by $0.00000406.
Bull, Base, and Bear Case
ScenarioPrice LevelTrigger ConditionInvalidation Level
Bull Case$0.00000507 – $0.00000558Breaks above 1H consolidation and 4H triangle resistanceFalls back below $0.00000466
Base Case$0.0000046 – $0.0000047Price stays range-bound inside consolidationSustained close outside either boundary
Bear Case$0.00000429 – $0.00000406Breaks below both 1H and 4H support levelsReclaims above $0.00000493
Long-Term Outlook
Where does this go from here? A lot depends on whether burn rates stay elevated or fade back to normal and whether volume across exchanges keeps building or dries up.
If SHIB does break out of this descending triangle with real volume behind it, that's the kind of setup that strengthens a more constructive Shiba Inu price prediction over the coming weeks.
Worth keeping in mind, though, these are probability-based reads off current technical conditions, and they can shift the moment new data comes in.
Glossary
Sideways action with no clear trend either way that's basically what consolidation means in chart terms.
A descending triangle forms when buyers keep defending a flat support line while sellers push resistance lower and lower, usually until something finally gives.
Ever wonder what a liquidation actually is? It's when an exchange force-closes a trader's leveraged position because they can't cover the losses anymore.
RSI, or Relative Strength Index, is a 0-to-100 momentum gauge that hints at whether something's overbought or oversold.
Burn rate just refers to how fast tokens get permanently pulled out of circulation through burning.
Methodology
This shiba inu price prediction leans on TradingView chart data across the 1-hour and 4-hour timeframes, paired with liquidation and volume figures from Coinglass.
Every support, resistance, and target level here comes straight from what's visible on the charts, not guesswork or extrapolation.
Markets move fast, though, so treat this as one piece of the puzzle, not the whole picture, when making trading calls.
Disclaimer: This article is for informational purposes only and does not constitute financial advice. Cryptocurrency markets are highly volatile, and past price behavior does not guarantee future results. Always conduct independent research before making investment decisions.