Shiba Inu price prediction chatter is heating up again right as the token heads into its 6th birthday. A fresh green candle, a spike in burns, and a bullish chart setup have all landed togeth
Shiba Inu price prediction chatter is heating up again right as the token heads into its 6th birthday.
A fresh green candle, a spike in burns, and a bullish chart setup have all landed together, and traders want to know if this is the start of something bigger.
Key Takeaways
$SHIB completes 6 years on August 2, 2026, as confirmed by the project's official X account.
Burns jumped 1395.57% over the past 30 days, with 3,248,854,065 SHIB destroyed.
The 4-hour chart shows a 50 and 100 EMA bullish crossover from July 25 that fueled a 36-40% rally.
Price is retesting the upper edge of a rising channel near $0.00000490.
RSI sits at 62.21, leaving room before overbought territory returns.
What Is the Shiba Inu Price Prediction for August 1, 2026?
As of 10:25 AM IST on August 1, 2026, this Shiba Inu price prediction places $SHIB at $0.00000490, down 1.01% on the 4-hour candle.
Price is retesting its 50 EMA support inside a rising channel, with resistance stacked above at $0.00000519, $0.00000556, and $0.00000583.
What Do Shiba Inu's Market Cap and Supply Numbers Show?
Market cap sits at $2.88 billion, up 4.36% in 24 hours, with daily volume at $146.8 million, a jump of 57.47%. 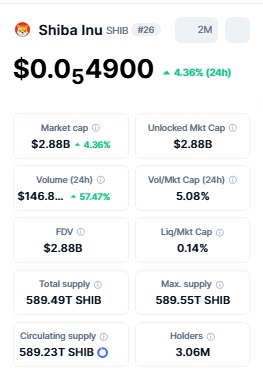
Circulating supply stands at 589.23 trillion SHIB out of a 589.55 trillion max supply, held across 3.06 million wallets, as per data from CoinMarketCap.
Why Is Shiba Inu's 6th Anniversary in Focus Right Now?
As per the post by @Shibtoken on X, SHIB turns 6 tomorrow, with the community already in birthday mode ahead of the milestone.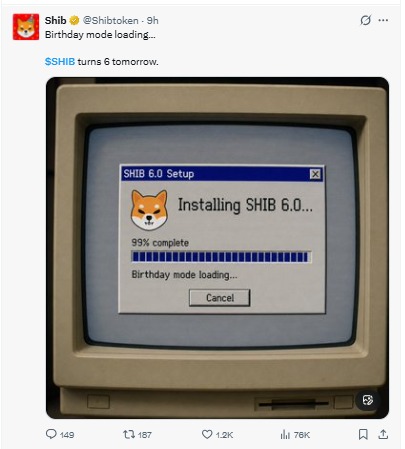
Anniversary dates for community-driven tokens often bring a temporary spike in attention and trading activity.
How Much SHIB Has Been Burned Ahead of the Anniversary?
As per the post by @shibburn on X, 3,248,854,065 SHIB were burned in the past 30 days, a 1395.57% burn rate increase landing right before the milestone date. 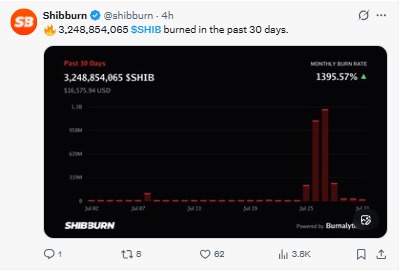
The figure is also confirmed on Shibburn's official burn tracking website, which logs real-time SHIB burn transactions. Token burning permanently removes coins from the circulating supply
How Does the SHIB 4-Hour Chart Structure Look Right Now?
The TradingView 4-hour SHIB/USDT chart tells a clear story of a coin waking up from a long sleep. For nearly a month, price stayed boxed between $0.00000400 and $0.00000450, barely making headlines.
What Triggered the Bullish EMA Crossover?
That changed on July 25, 2026, when the 50 EMA and 100 EMA, exponential moving averages that smooth out price to show trend direction, crossed bullish on the 4-hour time frame.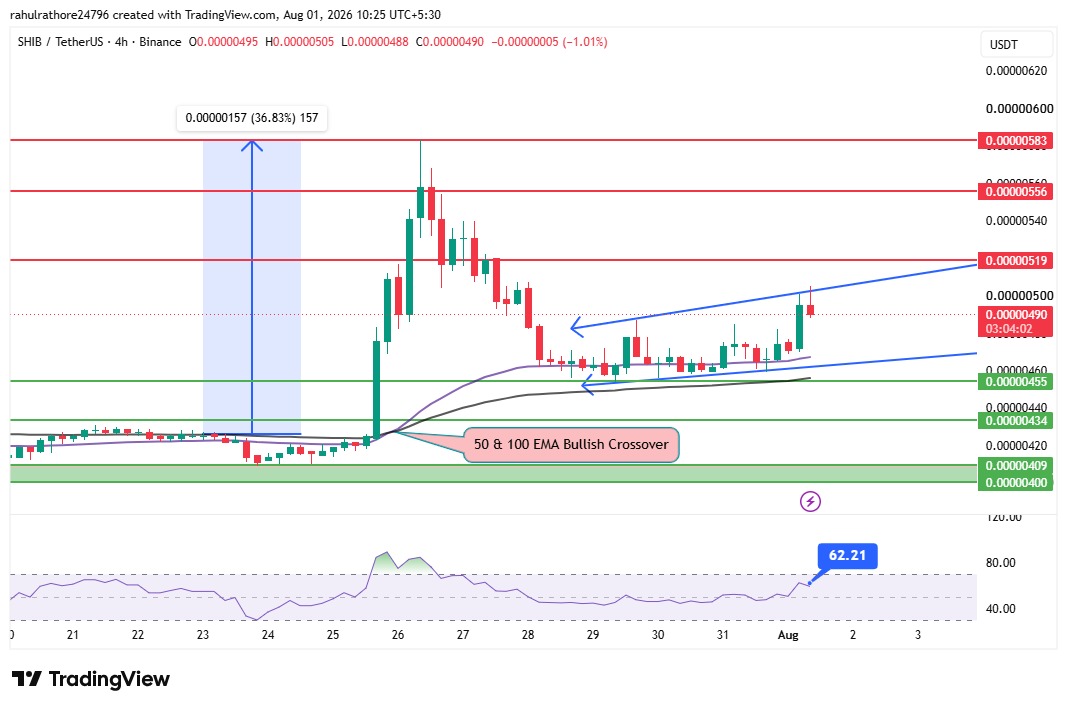
The move that followed was sharp, with price rallying roughly 36-40% and tagging $0.00000583 within two days.
That kind of speed pushed the Relative Strength Index, or RSI, a momentum gauge that flags overbought or oversold conditions on a 0-100 scale, all the way up to 90.
Anything above 70 is typically read as overbought, so a pullback was almost expected. Price cooled off from there and is now coming back down to retest the 50 EMA.
What Are the Key Support and Resistance Levels for SHIB?
Right now, $SHIB is trading near the upper edge of a rising channel that has formed since the July 25 breakout.
The 50 and 100 EMA cluster below is acting as dynamic support, and as long as price holds above it, the broader structure stays bullish.
Level Type
Price
Note
Resistance 3
$0.00000583
July 25 rally high
Resistance 2
$0.00000556
Mid-range resistance
Resistance 1
$0.00000519
Rising channel breakout target
Current Price
$0.00000490
4H close, Aug 1, 10:25 AM IST
Support 1 (EMA)
$0.00000455
50 EMA-cluster
Support 2 (EMA)
$0.00000434
100 EMA-cluster
Support 3
$0.00000409
Prior range high
Support 4
$0.00000400
Monthly range floor
If the price closes a 4-hour candle above the channel and clears $0.00000519, the path toward $0.00000556 and then $0.00000583 opens up.
A 4-hour close below the EMA cluster instead would put $0.00000409 and $0.00000400 back in focus.
Methodology: Targets map to horizontal support/resistance on the chart, anchored by the July 25 rally high and the monthly range low. The EMA cluster separates bull and bear paths; RSI above 70 flags bull-case weakness.
What Do SHIB Liquidation and Long/Short Data Reveal?
Positioning data adds another layer here. 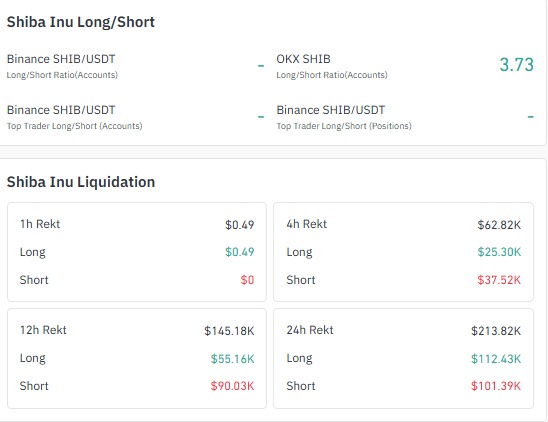
As per CoinGlass, the Binance versus OKX long/short account ratio for $SHIB currently reads 3.73, showing accounts skewed heavily toward longs.
Timeframe
Total Liquidated
Long
Short
1 Hour
$0.49
$0.49
$0
4-Hour
$62.82K
$25.30K
$37.52K
12 Hour
$145.18K
$55.16K
$90.03K
24-Hour
$213.82K
$112.43K
$101.39K
Shorter timeframes show shorts taking the bigger hit, lining up with the recent bounce off the EMA retest. Zooming out to 24 hours, longs and shorts sit closer to balanced, suggesting the market has not fully committed either way.
What Is the Shiba Inu Price Prediction Bull, Base, and Bear Case?
Scenario
Target Range
Assumption
Invalidation
Bull
$0.00000519 to $0.00000583
4H close above channel and $0.00000519; RSI stays under 70
Rejection at $0.00000519 with bearish 4H close back inside channel
Base
$0.00000434 to $0.00000519
Price holds EMA-cluster and chops sideways into anniversary
Break of either boundary on strong volume
Bear
$0.00000400 to $0.00000409
4H close below 50 and 100 EMA cluster
Reclaim of $0.00000455 EMA-support
These levels are derived directly from the current 4-hour chart structure and should be treated as scenario ranges, not guarantees.
A broader market selloff or unexpected news could invalidate any of the three paths outlined above.
What Does Analyst Say About This Shiba Inu Price Prediction?
A CoinGabbar analyst notes the burn spike alongside the anniversary date is unlikely to be coincidental, since community-driven tokens like $SHIB often see coordinated activity around milestone events.
The chart structure backs the optimism for now, with price holding above both key EMAs.
However, the analyst flags that RSI cooling from 90 to 62.21 shows the rally has already lost steam, and a rejection at $0.00000519 would weaken the near-term bullish case.
Is Shiba Inu a Good Investment Ahead of Its Anniversary?
Whether $SHIB fits a portfolio depends on individual risk appetite. It remains extremely volatile, and price action around anniversary dates can swing quickly either way.
Burn increases are often cited as a long-term positive, but a 30-day burn of roughly 3.25 billion tokens is still a tiny fraction of the 589 trillion circulating supply, moving the needle only marginally.
Disclaimer: This article is for informational purposes only and does not constitute financial advice. Cryptocurrency markets are highly volatile, and price predictions are speculative by nature. Always do your own research and consult a licensed financial advisor before making investment decisions.