Shiba Inu launched in August 2020 as a meme token, then grew into a full ecosystem with its own layer-2 network, Shibarium, and a burn mechanism that removes tokens from circulation over time
Shiba Inu launched in August 2020 as a meme token, then grew into a full ecosystem with its own layer-2 network, Shibarium, and a burn mechanism that removes tokens from circulation over time.
That combination turned a joke coin into one of the most traded assets in crypto. But the token's price still trades in fractions of a cent, and that never changed.
And that history still shapes how the Shiba Inu Coin community reacts to every rally and why this Shiba Inu price prediction keeps circling back to it.
SHIB is trading near $0.00000589, up 2.1% on the day. Market cap sits around $3.471 billion, with a circulating supply near 589 trillion tokens.
The Shiba Inu price today shows a market still climbing out of a long slump.
Live Market Data of Shiba Inu Coin
Metric
Value
Price
$0.00000589
24H Change
+2.1%
24H Range
$0.00000574 - $0.00000602
Market Cap
$3.471B
Source: market data taken from CoinGecko, as of Sep 26, 2026. Figures may vary slightly across other tracking websites.
SHIB Burn Rate Update
Shibburn posted fresh numbers, and the pace stood out. The burn tracker reported 2,184,538 $SHIB destroyed in the past 24 hours, worth close to $12.67, with the post going out around Sep 26, 2026, 00:45 UTC.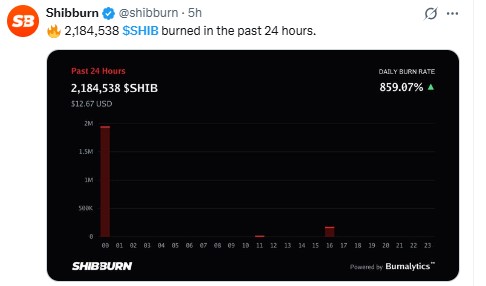
Source: Data Taken From @shibburn, X Account, as of Sep 26, 2026
That's a daily burn rate jump of 859.07%. But a burn spike this size on a supply this large barely moves the needle on scarcity alone.
$SHIB Market Sentiment
U.Today flagged something worth repeating. Their post, published around Sep 25, 2026, 12:45 UTC, noted $SHIB enters October with an 80% win rate historically, backed by a 39.3% third quarter pump and what the outlet called a technical breakout from a two-year slump.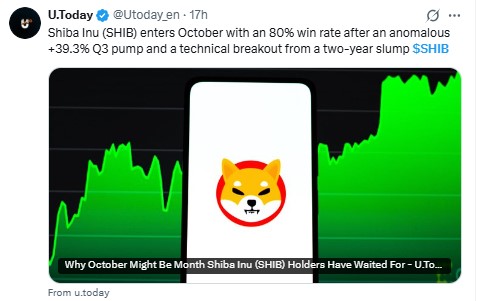
Source: Data Taken From @Utoday_en, X Account, as of Sep 26, 2026
An 80% win rate sounds strong on paper. Does that pattern hold up once the channel gets tested for real?
Fine. The chart still has to prove it.
Shiba Inu Coin Technical Analysis
This Shiba Inu technical analysis starts with the channel everyone is watching.
On the hourly chart, SHIB is trading inside an ascending channel, a pattern where price climbs between two parallel rising lines. 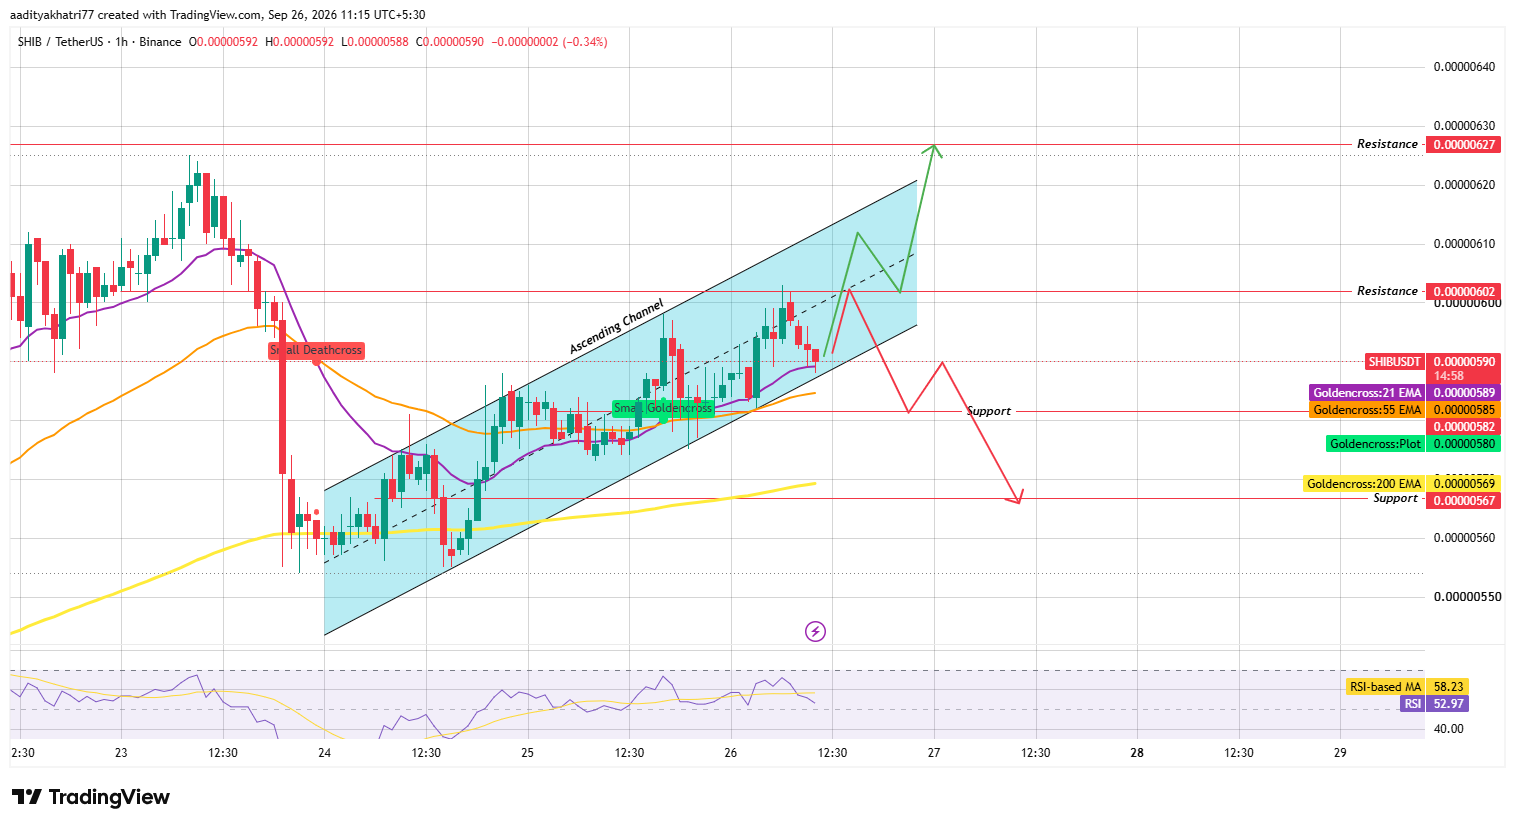
Source: Chart taken from TradingView, as of Sep 26, 2026
RSI sits at 52.97, just below its moving average of 58.23. That's a soft read, not a strong one, and the channel is getting tested right at resistance.
Can $SHIB Push Toward Higher Resistance?
A bounce off the lower boundary followed by a break above $0.00000602 on real volume opens the door toward $0.00000627 next.
The 21 EMA at $0.00000589 has been acting as short-term support inside the channel. Hold above it, and the bullish case stays intact. That's the setup bulls want to see.
What Happens If $SHIB Gets Rejected?
Rejection at resistance changes the picture fast.
A break below the channel's lower boundary and the $0.00000582 zone would send $SHIB toward $0.00000567 support.
And losing the 200 EMA near $0.00000569 too would mean the channel structure breaks down entirely.
Breakdowns from ascending channels tend to move sharp once support fails.
And $SHIB has already shown a small death cross earlier this week, a signal where a shorter moving average crosses below a longer one.
EMA Levels (1H Chart)
EMA
Level
21 EMA
$0.00000589
55 EMA
$0.00000585
200 EMA
$0.00000569
Support
Resistance
$0.00000582
$0.00000602
$0.00000567
$0.00000627
Bull, Base, and Bear Scenarios
Scenario
Setup
Level
Bull
Channel breakout with volume
$0.00000602 to $0.00000627
Base
Channel holds, range trade
$0.00000582 to $0.00000602
Bear
Channel breakdown
$0.00000582 to $0.00000567
Shiba Inu vs Bitcoin
Bitcoin's own range-bound action tends to set the tone for meme-coin liquidity, and SHIB is no exception.
A risk-on tape helps channel breakouts stick. A risk-off move tends to drag SHIB's support levels lower regardless of what the burn rate is doing that day.
Methodology
This Shiba Inu Price Prediction was built from an hourly SHIBUSDT chart sourced through Binance via TradingView, checked candle by candle for the channel boundaries and EMA levels.
Support and resistance zones came directly from the marked price levels on that chart.
Live price, market cap, and burn figures came from separate data snapshots taken the same day.
Nothing here substitutes for independent research; markets move fast, and a chart pattern only describes probability, not certainty.
Expert Opinion
Market commentary around Shiba Inu News this week leaned cautiously bullish.
Analysts pointed to the Q3 rally and the historical October win rate as reasons for optimism, while noting the current test at channel resistance is the real decision point.
Turns out, a strong seasonal stat means little if the channel can't hold above $0.00000602 with volume behind it.
Disclaimer: This article is for informational purposes only and does not constitute financial advice. Cryptocurrency markets, including Shiba Inu, carry high volatility and downside risk; prices can move sharply against any projected level, and past performance offers no guarantee of future results. Readers should conduct independent research before making any investment decision.