This Shiba Inu price prediction looks at whether the pattern extends into a fresh breakout or gives way to a pullback. With the token up sharply over the past day and short positions absorbin
This Shiba Inu price prediction looks at whether the pattern extends into a fresh breakout or gives way to a pullback.
With the token up sharply over the past day and short positions absorbing most of the recent liquidation losses, traders following Shiba Inu Coin watching this channel test as a key signal for the next move.
Shiba Inu launched in 2020 as a meme token inspired by Dogecoin, built around a large-supply model designed to keep individual token prices extremely low and accessible.
It later expanded well beyond its meme-coin origins through its own ecosystem, including the Shibarium layer-2 network, which aims to improve transaction speed and reduce fees, and the ongoing Shibburn initiative, which tracks tokens permanently removed from circulation to gradually reduce total supply.
The Shiba Inu price today is $0.00000534, up 6.1% over the past 24 hours.
The 24-hour range has held between $0.00000501 and $0.00000539, and this Shiba Inu price today snapshot reflects data current as of September 18, 2026.
Live Market Data
Metric
Value
Price
$0.00000534
24h Change
+6.1%
24h Range
$0.00000501 - $0.00000539
Market Cap
$3.146B
Fully Diluted Valuation
$3.147B
24h Trading Volume
$94.773M
Circulating Supply
589.239T
Total Supply
589.496T
Source: $SHIB market data taken from CoinGecko, as of Sep 18, 2026. Figures may vary slightly across other tracking websites.
Exchange Volume
Trading volume is spread across a mix of exchanges, led by LBank at $18.99M, followed by OKX at $17.56M and MEXC at $15.76M. 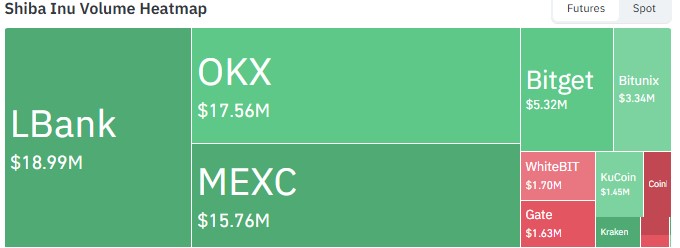
Source: Volume Heatmap Data Taken From CoinGlass, As of Sept 18, 2026.
Bitget, Bitunix, Gate, WhiteBIT, and KuCoin each contribute smaller amounts, rounding out a fairly diversified liquidity base for Shiba Inu news watchers tracking exchange activity rather than volume concentrated on a single platform.
Liquidation Snapshot
Timeframe
Total Liquidated
Longs
Shorts
1h
$5.30
$5.30
$0
4h
$775.87
$400.13
$375.73
12h
$29.77K
$25.43K
$4.34K
24h
$93.60K
$28.56K
$65.05K
Source: Liquidation Data Taken From CoinGlass, As of Sept 18, 2026.
Short positions have absorbed more than double the losses of longs over the past 24 hours, suggesting traders betting against $SHIB were caught off guard by the recent move higher.
If the channel holds and the price pushes toward resistance, continued short covering could add further momentum to any upside move.
Shiba Inu Coin News
The Shibburn tracker reported 9,913,821 SHIB burned in the past 24 hours, worth roughly $49.48, though the daily burn rate fell 48.24% compared to the prior period. 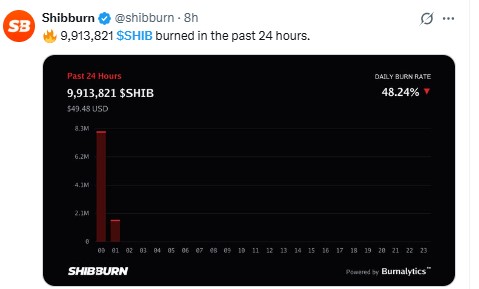
Source: Data Taken From @shibburn, X Account, as of Sep 18, 2026
Technical Analysis for Shiba Inu Coin
The hourly chart shows SHIB trading inside a well-defined ascending channel, with price recently pulling back toward the channel's midline after testing its upper band. 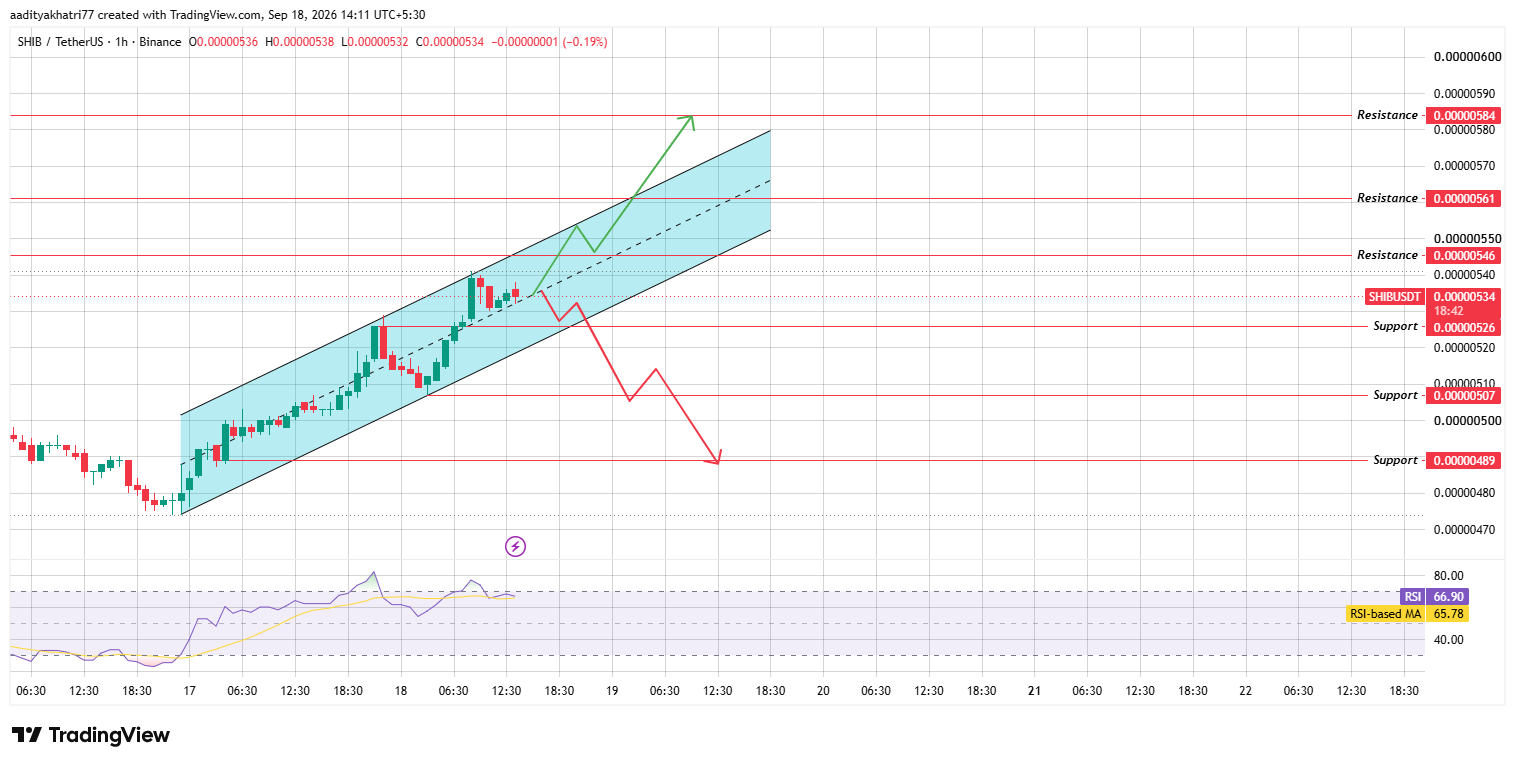
Source: Chart taken from TradingView, as of Sep 18, 2026
RSI sits at 66.90, above its moving average of 65.78, reflecting strong but slightly extended momentum.
This Shiba Inu technical analysis points to a market leaning bullish while still respecting the channel's established boundaries.
Can $SHIB Break Toward Higher Resistance?
If volume increases and price clears $0.00000546, the next resistance sits at $0.00000561.
A confirmed break above the channel's upper boundary would open the path toward $0.00000584, a level that represents roughly a 9% move from the current price and anchors this Shiba Inu price prediction 2026 scenario.
Sustained volume would be needed to confirm this move rather than a brief wick above resistance.
What Happens If $SHIB Breaks Support Instead?
If buying pressure fades and the price breaks below $0.00000526, the setup shifts bearish.
A deeper move could test $0.00000507, and a confirmed break of the channel's lower boundary may expose $0.00000489, unwinding much of the recent rally.
Support and Resistance Levels
Support
Resistance
$0.00000526
$0.00000546
$0.00000507
$0.00000561
$0.00000489
$0.00000584
Bull, Base, and Bear Scenarios
Scenario
Setup
Level
Bull
Channel breakout with volume
$0.00000546 → $0.00000584
Base
Continued range inside channel
$0.0000053 - $0.0000054
Bear
Support break, channel breakdown
$0.00000526 → $0.00000489
Methodology
This shiba inu price prediction is based on hourly chart analysis using ascending channel mapping, support and resistance identification, and RSI momentum readings, cross-checked against live market data as of September 18, 2026.
Expert Opinion
Analysts tracking SHIB's ascending channel note that repeated tests of the upper boundary without a breakdown typically strengthen the case for an eventual breakout, though confirmation would require sustained volume rather than a single hourly candle pushing through resistance.
Disclaimer: This Shiba Inu price prediction is based on technical chart analysis and current market data and should not be treated as financial advice. Cryptocurrency markets are highly volatile, and readers should conduct their own research and consider their risk tolerance before making any investment decisions.