The Shiba Inu price prediction for this week opens with a contradiction. SHIB is up 1.7% today, yet a widely shared headline says the coin still struggles against selling pressure. Shiba Inu
The Shiba Inu price prediction for this week opens with a contradiction. SHIB is up 1.7% today, yet a widely shared headline says the coin still struggles against selling pressure.
Shiba Inu launched in August 2020 under the pseudonym Ryoshi. It started as a Dogecoin-inspired meme token and later grew into a coin with its own Shibarium network.
For the latestShiba Inu price today, the Shiba Inu coin trades at $0.00000590, up 1.7% over 24 hours. SHIB ranks #36 with a market cap of $3.48B, and its 24-hour range runs from $0.00000568 to $0.00000592.
Shiba Inu Today Market Data
Metric
Value
Price
$0.00000590
24h Change
+1.7%
24h Range
$0.00000568 - $0.00000592
Market Cap
$3.48B
Source: market data taken from CoinGecko, as of Oct 2, 2026. Figures may vary slightly across other tracking websites.
Shiba Inu News Today
The latest Shiba Inu news comes from U.Today. Its post says SHIB is having trouble building real strength against the selling pressure that still weighs on the wider market.
The linked headline adds a second detail. According to U.Today, the top 10 SHIB whales added 10 billion tokens within 24 hours.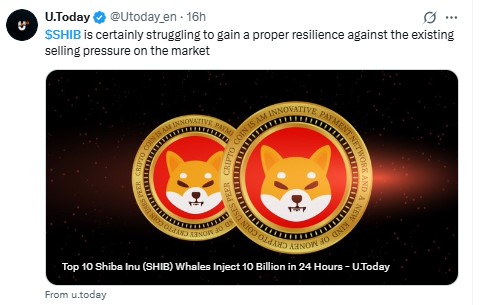
Source: Data Taken From @U.Today_en on X, October 2, 2026
At today's price, 10 billion SHIB is worth about $59,000. That equals roughly 0.0017% of the circulating supply. The buying is real, but it is small next to a $3.48B market cap.
The two messages do not fully agree. One points to weak demand, while the other shows large holders adding. Traders should let the chart decide which one carries more weight.
Shiba Inu Technical Analysis
This Shiba Inu technical analysis uses the 4-hour SHIBUSDT chart on Binance, captured at 10:29 IST on October 2, 2026. The active candle closes at 08:00 UTC, which is 13:30 IST.
Price has been moving inside a descending triangle. A falling trendline caps the upper side, while a flat base near $0.00000556 holds the lower side. 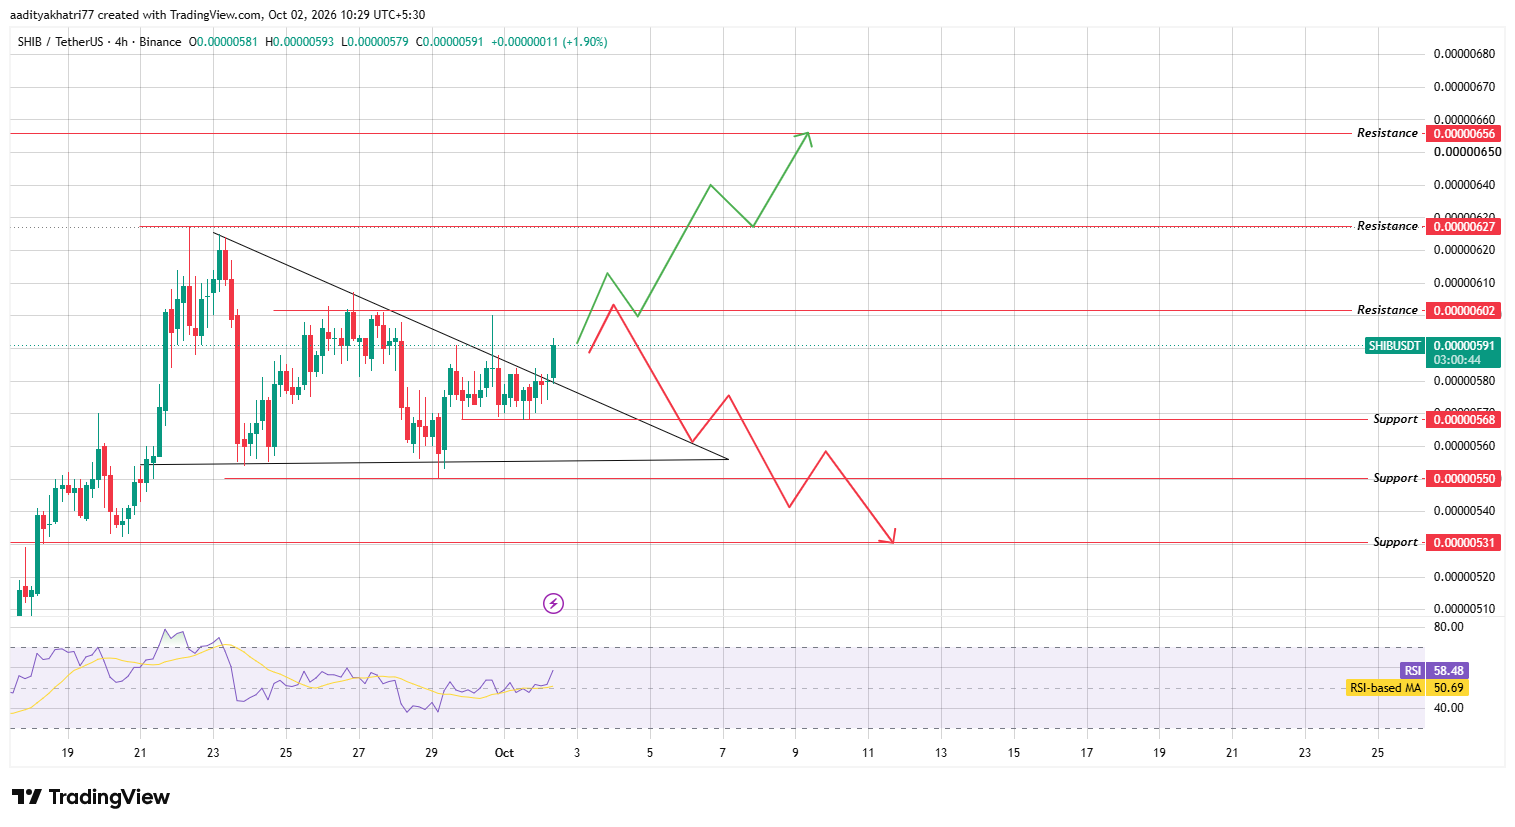
Source: Chart taken from TradingView, October 2, 2026
$SHIB has now pushed above that falling trendline, which sits near $0.00000580.
The move is not confirmed yet. The 4-hour candle is still open, so the price can slip back under the line before it closes.
A descending triangle also tends to resolve lower, which adds some risk to the upside view.
The RSI reads 58.48 against a moving average of 50.69. Momentum has improved, and it is not stretched. The first resistance at $0.00000602 is the level that matters most for the next step.
Shiba Inu Price Prediction: Can SHIB Reach Higher Resistance?
The bullish case starts with a close. A 4-hour candle must finish above the falling trendline near $0.00000580. Without that close, the breakout stays a probe.
The next test is $0.00000602, about 1.9% above the current price. Price failed near this zone in late September.
A 4-hour close above it should come with volume above the average of the previous 20 candles. A close on thin volume would not be enough.
Once that level gives way, the chart shows $0.00000627 as the next resistance, roughly 6.2% higher. That price matches the swing high from around September 22 to 23.
The final resistance is $0.00000656, about 11.1% above today's price. Reaching it would mean SHIB clears the entire triangle structure and keeps buyers in control.
What Happens If Shiba Inu Is Rejected?
The bearish case begins with a rejection. If SHIB reaches $0.00000602 and turns back, the move above the trendline would look like a false breakout.
Price would then slide back toward $0.00000568, about 3.8% below the current level.
A 4-hour close under that support would show sellers regaining control inside the triangle.
The next support is $0.00000550, close to 6.9% lower. It sits near the flat base of the triangle, so a close below it would complete the downward break.
From there, the chart points to $0.00000531, a drop of about 10.1%.
Price Levels to Watch
Support
Resistance
$0.00000568
$0.00000602
$0.00000550
$0.00000627
$0.00000531
$0.00000656
Bull, Base, and Bear Scenarios
Scenario
Setup
Level
Bull
4H close above the trendline and $0.00000602 with rising volume
$0.00000627, then $0.00000656
Base
Price stays between support and the first resistance.
$0.00000568 - $0.00000602
Bear
Rejection at resistance, then 4H close below support
$0.00000568, then $0.00000550 and $0.00000531
Shiba Inu vs Bitcoin
Shiba Inu usually follows Bitcoin's lead, and it often swings harder in both directions. A calm Bitcoin gives SHIB room to test resistance. A sharp drop in BTC tends to pull it toward support.
Today the pair shows a gap. SHIB gained 1.7% in dollars but lost 1.3% against Bitcoin, so Bitcoin rose faster over the same 24 hours.
Burn tracking through Shibburn and activity on Shibarium can shape long-term supply and demand. They are not part of the chart levels used here.
Methodology
This Shiba Inu price prediction draws on three inputs. Levels, the triangle, and the RSI come from the Binance SHIBUSDT 4-hour chart on TradingView.
Market data comes from CoinGecko, and the news item comes from U.Today.
Every signal here depends on a closed 4-hour candle, because an open candle can reverse before it ends. All percentage moves are measured from the live price of $0.000005906. We left out unverified claims and rumors.
Expert Opinion
General market commentary on descending triangles often stresses one point: the first break is not always the final one.
Chart watchers usually wait for a close and a volume increase before they trust it.
The same commentary notes that whale buying can help sentiment, but small amounts rarely change direction alone.
For this Shiba Inu Coin price prediction, the 4-hour close above $0.00000602 remains the clearest signal.
Disclaimer: This article is for information only and is not financial advice. Crypto prices are volatile. SHIB can fall below every support level named here, including a drop of about 10% or more in the bear case. No scenario is guaranteed, and readers should research independently and invest only what they can afford to lose.