Is SHIB quietly building a floor or just catching its breath before another leg lower? That's the puzzle behind this Shiba Inu price prediction. On October 19, 2026, at 10:45 UTC, the Shiba I
Is SHIB quietly building a floor or just catching its breath before another leg lower?
That's the puzzle behind this Shiba Inu price prediction. On October 19, 2026, at 10:45 UTC, the Shiba Inu price today sits at $0.000005000, flat inside a descending channel.
It follows theCPI-driven selloff from mid-October. Buyers defended $0.00000480. But nobody's calling that a reversal yet.
Shiba Inu Price Today: Market Data Snapshot
Figures below come from CoinMarketCap $SHIB data as of 10:45 UTC.
Metric
Value
Price
$0.000005000
24H change
+0.46%
24H range
$0.000004803 to $0.000005034
Market cap
$2.94B (rank 32)
24H volume
$47.83M (+42.95%)
Volume jumped 42.95% while price barely moved. Busy tape, no direction.
At $2.94B, the SHIB market cap ranks #32. And SHIB trading volume is just 1.61% of it, so thin books can spike fast.
Why Is Shiba Inu Moving Today?
SHIB bounced. One 4H candle ripped from near $0.00000480 back above $0.00000499. Sellers stalled right at the channel's upper edge. Anearlier EMA rebound setup ran into those same overhead averages.
SHIB Futures Data and Liquidity
CoinGlass futures data shows $31.10M in futures volume. Open interest, the total value of open futures contracts, sits at $50.31M.
Liquidations hit $51.80K in 24 hours, and longs took $49.38K of it. OKX accounts lean long at a 2.85 ratio. Crowded longs on a flat chart. So who's really in control here?
$SHIB Holder Concentration on Etherscan
Etherscan holder data counts 1,698,647 holders.
But whales, 790 wallets, or 0.05% of holders, control 94.68% of market cap. The top 5 holders own 57.94%. A Gini score near 1 means supply sits in very few hands. SHIB's reads 0.9959.
Burn Wallet Share and Supply Check
The null address holds 41.04% of tracked supply, worth about $2.05B. Nobody can spend it.
That pile ties back to theburn rate spike covered earlier. Circulating supply stands at 589.23T against a 589.55T max, so dilution isn't the worry.
SHIB Technical Analysis: 4H Descending Channel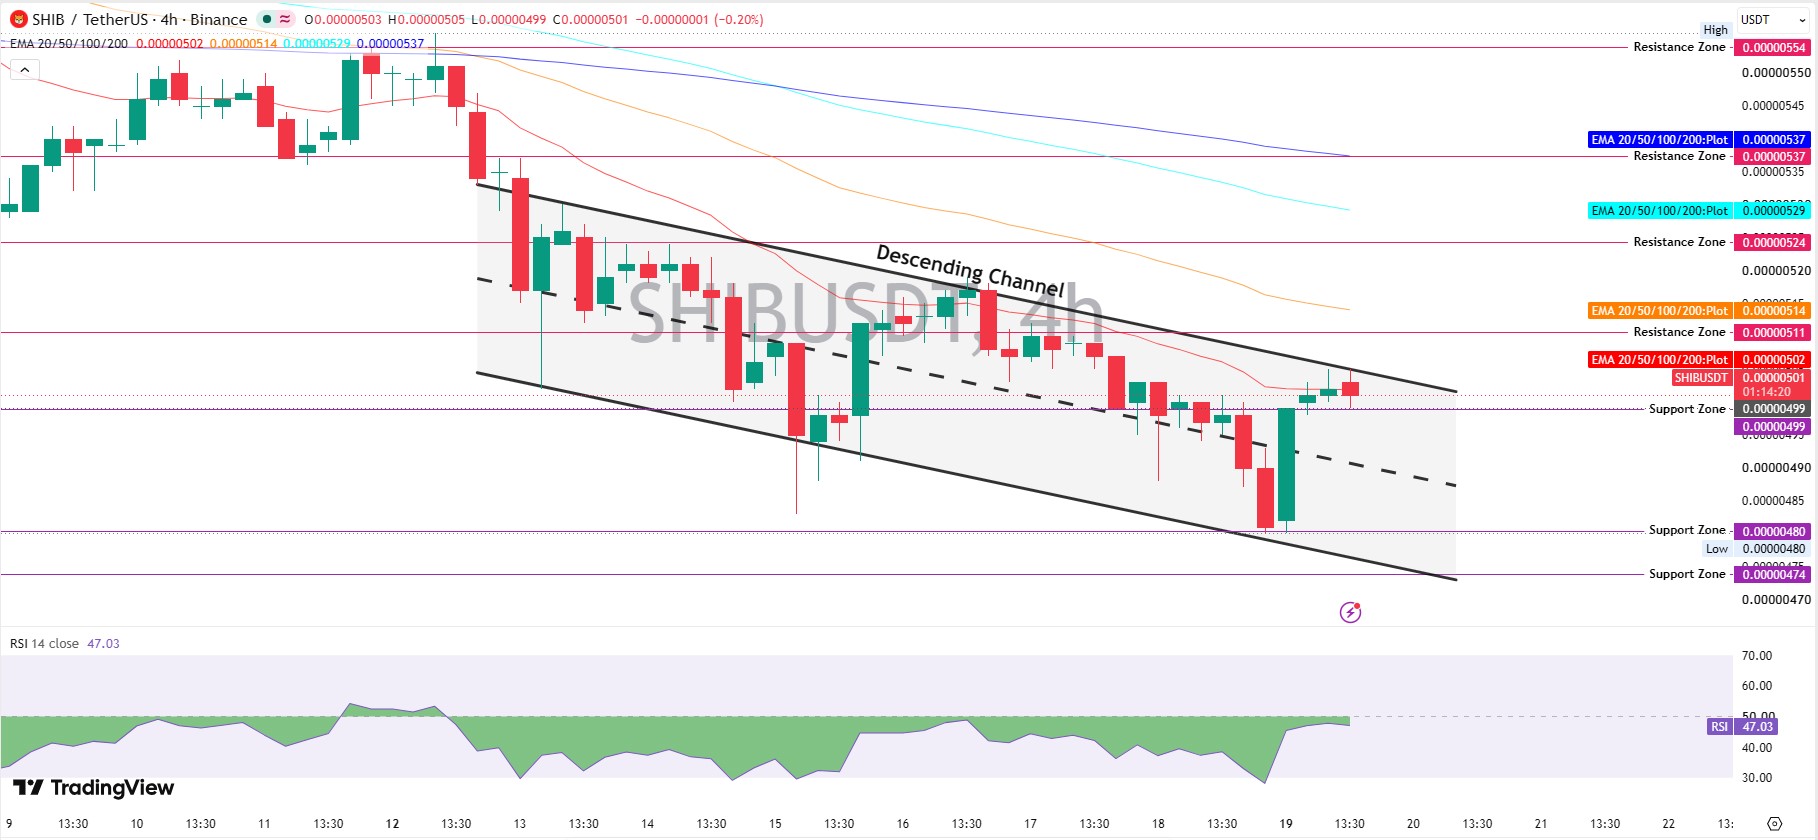
The TradingView SHIB/USDT chart on Binance shows lower highs and lower lows since October 12. Price trades between two falling parallel lines.RSI is 47.03; momentum tilts a touch weak, not oversold.
An EMA is a moving average that weights recent trades more heavily. The 20 EMA, 50 EMA, 100 EMA, and 200 EMA sit at $0.00000502, $0.00000514, $0.00000529, and $0.00000537.
Price trades at or below all four. Which means every bounce meets a wall.
Key Support Levels
Support is a floor where buyers stepped in before. First comes $0.00000499, then $0.00000480, then $0.00000474.
Key Resistance Levels
Resistance is a ceiling where sellers appeared before. Overhead sits at $0.00000511, $0.00000524, $0.00000537, and $0.00000554. $0.00000537 matches the 200 EMA. That one carries extra weight.
Descending Channel Breakout Test
A breakout needs a push through the upper line with rising volume. Trades above $0.00000511 would be the first sign.
Support held at $0.00000480, so a bounce seemed to be starting. Actually, scratch that. One green candle doesn't flip a channel. For contrast, an earlierexplosive chart move report covers SHIB on a different setup.
Shiba Inu Price Forecast: Scenario Table
Three paths shape the Shiba Inu price forecast, each with its own trigger and exit.
Scenario
Trigger
Targets
Invalidation
Liquidity condition
Bull
Trades above $0.00000511 and holds
$0.00000524, $0.00000537, $0.00000554
Rejection at $0.00000511
Volume above $47.83M daily pace
Base
Chop inside the channel
$0.00000480 to $0.00000511
Break of either edge
Volume cools, liquidations stay low
Bear
Loses $0.00000480
$0.00000474
Reclaim of $0.00000499
Volume rises with long liquidations
Rotation across the sector shows up first inmeme coin news.
Bias stays bearish while price trades under $0.00000511. The SHIB price prediction for $0.00000554 needs roughly 10.8% upside through four EMAs, and that's a stretch.
Shiba Inu News Today: Any Verified Catalyst?
Partnership or burn announcement backs today's bounce. And that matters.
Moves without news usually trace back to positioning, which fits the futures data. Past channel coverage, including theRakuten Coin channel report, adds earlier context.
Long-Term SHIB Price Outlook
Price sits 94.34% below the $0.00008845 all-time high from October 28, 2021. Recovery from there is a multi-year story.
Performance runs 7D -8.93%, 30D -8.36%, 90D +17.69%, and YTD -27.59%. The 90-day gain is the only green number.
TheSeptember Shiba Inu forecast gives an earlier framework. Targets beyond the EMA stack stay guesses.
Risks That Could Change the Shiba Inu Price Prediction
Whale concentration tops the list. One large sale into $47.83M of daily volume would hit hard.
Long liquidations could cascade if $0.00000480 breaks. And a Bitcoin drop would drag meme coins lower. Sentiment pops, like theJapan listing milestone, fade fast without volume.
Final Takeaway
Bias stays bearish below $0.00000511. Price trades under four EMAs, the RSI reads 47.03, and the channel is intact.
A reclaim of $0.00000537 would change that. Until then, this Shiba Inu price prediction favors patience.
Disclaimer: This article is for informational purposes only and isn't financial advice. Crypto prices are volatile and can move sharply in either direction. Research independently and consult a licensed advisor before making decisions.