Silver price crashed below $60 again today after briefly breaking this level a couple of days ago during the relief rally in which gold price pumped above $4,100. The metal is now trading nea
Silver price crashed below $60 again today after briefly breaking this level a couple of days ago during the relief rally in which gold price pumped above $4,100. The metal is now trading near $57.85 at press time, giving back most of its recent gains.
The broader precious metals complex is under pressure. Gold is holding near $4,050. Silver price is showing more volatility, as it typically does. The relief rally was short-lived.
Popular analyst More Crypto Online decided to weigh in on the situation around silver. His analysis points to one more decline before a major low forms.
More Crypto Online tweeted his latest silver analysis:
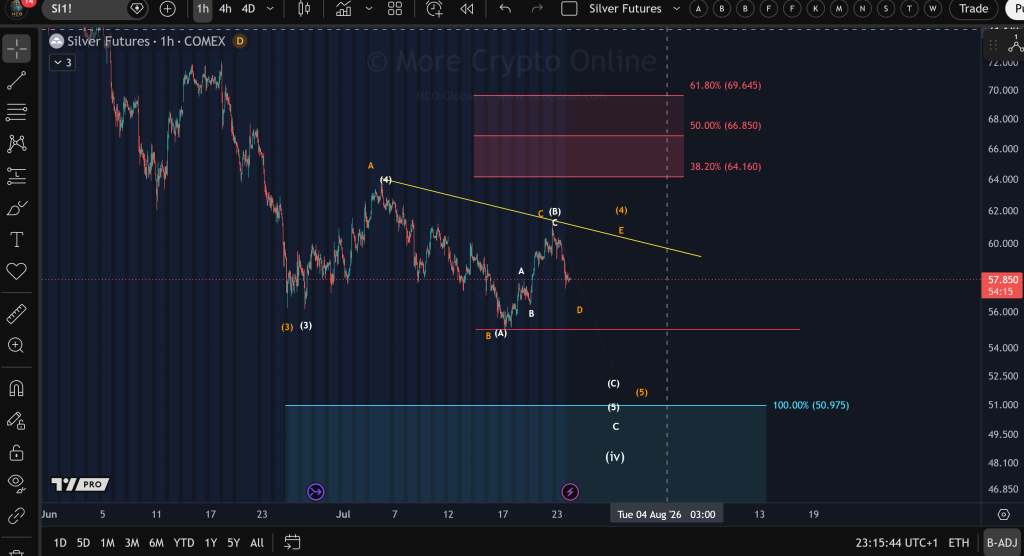
“Silver stuck in a broad sideways consolidation. Looks increasingly like a wave 4 triangle. Stay below $61.40 and another decline toward the lower boundary remains possible before a final lower high develops. Support at $55.40 then $51. Break above $61.40 and focus shifts to $64.16-$69.65. Even then, rallies have stayed corrective so far. Silver possibly approaching a major long-term low. Just not there yet.”
The analyst is watching two scenarios. Below $61.40, the bearish path remains intact with targets at $55.40 and $51. Above $61.40, the focus changes to $64.16-$69.65. Even in the bullish scenario, he warns that rallies have stayed corrective so far.
Silver Chart Analysis: Descending Resistance and Elliott Wave Structure
The 1‑hour COMEX Silver Futures chart shows a combined Elliott Wave count, ABC correction, descending resistance trendline, and Fibonacci retracement and extension targets.
The dominant trend remains bearish. Lower highs have been forming since the early July peak. Lower lows continue to develop. Price remains below the descending yellow trendline. Every rally has been sold into.
 Source: X/@moretradingonl
The recent bounce from approximately $55 up to $60 failed exactly where you would expect in a bear trend: descending resistance, previous swing resistance, and wave C/B completion area. That rejection is technically significant.
Elliott Wave interpretation: The move from the July high toward $55 appears impulsive. That likely represents Waves 1, 2, and 3. The move off $55 looks corrective rather than impulsive. Notice the overlapping candles, choppy structure, slow momentum, and no strong breakout. Those are classic correction characteristics. It looks more like an ABC correction, which matches the labels on the chart.
The descending trendline is the most important technical feature right now. It has rejected price multiple times. Until this line breaks decisively, the bears remain in control.
The recent rejection from the rally to $60 happened almost exactly where wave C ended, wave B ended (alternate count), and trendline resistance exists. Three resistances aligned. That is a high-probability sell zone.
Read also: Silver Price Alert: China Is Quietly Stacking Silver at a Record Pace
Fibonacci Levels and Key Silver Price Zones
Fibonacci resistance levels:
- 38.2% at $64.16 – Silver never even reached this level during the rally. That is bearish. Strong bullish reversals usually recover at least 38%. Failure before reaching it implies weak buying pressure.
- 50% at $66.85
- 61.8% at $69.65
Downside projection: The blue target zone ends around $50.98. If this is truly a Wave 5 or Wave C, then a move toward $51–52 is entirely plausible. That target aligns with prior support, measured extension, and Elliott equality projection.
Momentum: The rally lacks characteristics of a new bull trend. Overlapping candles, declining momentum, and lower swing highs all favor continuation lower.
Key Silver Price Levels
LevelImportance$60–61Descending trendline resistance$62Recent swing high$64.1638.2% Fibonacci retracement$66.8550% Fibonacci retracement$69.6561.8% Fibonacci retracement (major bearish invalidation zone)$55Critical support$51Primary bearish target
Trading Outlook
Short-term (1–3 days): Bearish. The rejection from descending resistance indicates sellers remain in control.
Medium-term (1–3 weeks): Moderately bearish. If price breaks below $55, the path toward $51–52 becomes the higher-probability scenario.
Bullish invalidation: A sustained move above the descending trendline and then above $62–63 would invalidate the immediate bearish wave count and increase the odds of a broader recovery toward the $64–67 Fibonacci region.
Read also: Robert Kiyosaki Just Made a Massive Gold and Silver Price Prediction
My Take on Silver Price Action
The silver chart’s bearish case is strengthened by the confluence of Elliott Wave completion, descending trendline resistance, and repeated lower highs. The next decisive level is $55. A break below it would significantly reinforce the expectation of another impulsive leg lower.
I assign the current technical picture approximately:
- 70% probability: The recent rally was an ABC corrective bounce, and silver resumes its decline toward $51–52.
- 30% probability: The rally from $55 develops into a genuine trend reversal, but this would require a confirmed breakout above the descending trendline and key swing highs.
Silver is approaching a major long-term low. But it is not there yet. The $51–55 zone is where the real buying opportunity likely appears.
Subscribe to our YouTube channel for daily crypto updates, market insights, and expert analysis.
The post Silver Price Prediction: $61.40 Is the Key, But Analyst Warns of One More Decline appeared first on CaptainAltcoin.