Silver price is under renewed pressure, falling toward the $62–$63 area as traders prepare for one of the most important Federal Reserve meetings of the year. The metal has already lost consi
Silver price is under renewed pressure, falling toward the $62–$63 area as traders prepare for one of the most important Federal Reserve meetings of the year. The metal has already lost considerable ground from its late-August peak above $70, and a closely watched technical pattern now creates the possibility of a deeper correction.
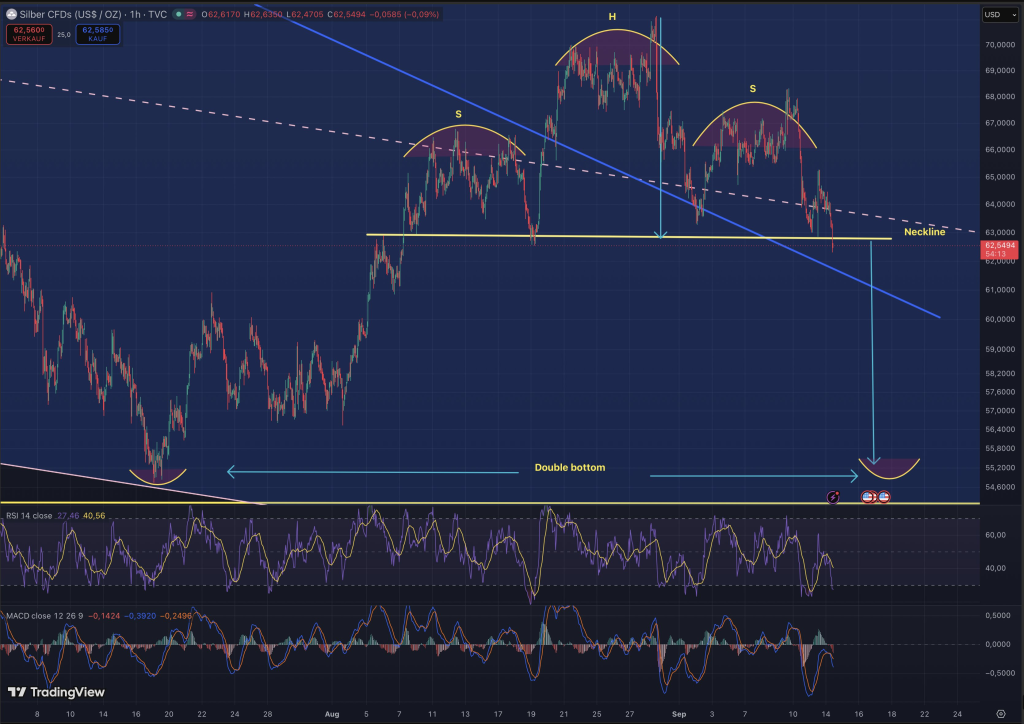
Trader Boz believes the latest breakdown keeps the short-term picture bearish. His chart shows the silver price moving beneath the neckline of a head-and-shoulders formation, while the full measured move from that pattern points toward approximately $55.
However, Boz isn’t arguing that silver must reach $55. His preferred scenario is more nuanced, with the Fed decision on Wednesday potentially determining how much further the current correction runs.
Silver Breaks the Head-and-Shoulders Neckline
The most important feature on Boz’s one-hour chart is the head-and-shoulders formation that has developed since August.
The left shoulder formed around $66–$67, followed by the head above $70. Silver subsequently recovered toward roughly $68 to form the right shoulder before sellers took control again. All three structures sit above a relatively clear neckline around $62.8–$63.
Silver has now moved below that neckline, with the chart showing price around $62.55. That is why Boz is keeping his short position open for now. A head-and-shoulders breakdown is conventionally bearish, particularly when price fails to recover above the neckline after initially losing it.
 Source: X/@bozkaschi
There is another technical problem for bulls. Silver is also trading beneath the descending blue trendline visible on the chart. Together, the broken neckline and descending resistance leave sellers in control unless price can quickly recover the $63 area.
Does Silver Price Really Have to Fall to $55?
The dramatic part of the silver chart is the projected move toward approximately $55.
That target comes from the size of the head-and-shoulders formation. Measuring the distance between the head and neckline and projecting it downward produces an objective in the mid-$50s. Interestingly, that region also corresponds with silver’s August low, where Boz has drawn the possibility of a large double bottom.
But Boz doesn’t believe the textbook target necessarily has to be reached. Instead, he expects the current decline could develop as a more conventional Elliott Wave C wave within the broader corrective structure.
The momentum indicators also deserve attention. RSI is already around 27 on the chart, placing it in oversold territory, while MACD remains below zero and bearish. That combination means downside momentum is still present, but silver is becoming increasingly stretched on this short timeframe. A relief bounce could therefore occur without invalidating the larger bearish structure.
Read also: Gold and Silver Price Prediction for This Week: Fed Decision Could Change Everything
The Fed Could Decide How Deep the Silver Correction Goes
This is where Wednesday becomes particularly important.
The Federal Reserve meets September 15–16 and announces its rate decision at 2:00 p.m. ET Wednesday, followed by Chair Kevin Warsh’s press conference at 2:30 p.m. Expectations have changed dramatically in recent days: a Reuters poll published Monday found most economists now expect a rate increase, while market pricing put the probability at roughly 89%.
Silver price is already reacting to that environment. Spot silver fell another 2.5% to around $62.88 on Monday as higher oil prices, persistent inflation concerns, a stronger dollar and expectations for tighter Fed policy pressured precious metals.
A rate increase accompanied by a hawkish message could therefore reinforce the bearish technical setup. Higher rates and elevated Treasury yields increase the opportunity cost of holding non-yielding precious metals. Under that scenario, failure to recover $63 could expose lower areas around $60, followed eventually by the $55–$56 region marked on Boz’s chart.
A surprise hold would create a very different setup. Because markets are now heavily positioned for an increase, leaving rates unchanged could trigger a fast repricing in yields and the dollar. That could give oversold silver an opportunity to reclaim its neckline and potentially invalidate, or at least delay, the full head-and-shoulders target.
Silver Price Outlook Ahead of Wednesday
For now, bears have the technical advantage.
The first level to watch is approximately $63. A sustained recovery above the broken neckline would weaken the immediate bearish case, while $64–$65 would be the next region bulls need to reclaim. Above there, roughly $66–$68 becomes the larger resistance zone.
If silver remains below $63, however, the risk remains tilted toward another leg lower. The $60 area would be an important psychological level before attention turns toward the mid-$50s.
Boz’s $55 scenario should not be treated as inevitable. Head-and-shoulders targets frequently fall short, and the already-low hourly RSI increases the possibility of a rebound.
Subscribe to our YouTube channel for daily crypto updates, market insights, and expert analysis.
The post Silver Price Prediction: A Drop Toward $55 Is Now on the Table appeared first on CaptainAltcoin.