Silver had a good week, climbing about 5% from $58 to around $63.50–$64.10 an ounce. Softer U.S. jobs data made people think the Fed might not tighten as much, which helped. Lower Treasury yi
Silver had a good week, climbing about 5% from $58 to around $63.50–$64.10 an ounce. Softer U.S. jobs data made people think the Fed might not tighten as much, which helped. Lower Treasury yields and a weaker dollar also gave precious metals a boost, letting silver bounce back from that $55.80 monthly support level.
Now the rally is running into a wall near $63. That’s a key resistance zone on the weekly chart. The big question for August 10–16 is whether the silver price can push through or if it needs to take a breather first.
This week brings U.S. CPI, PPI, retail sales, consumer sentiment, and a 10-year bond auction. So a lot could depend on where yields and the dollar go from here.
News That Could Push the Silver Price This Week
U.S. inflation data will be the main macro catalyst. The calendar shows CPI at 3.4% year over year, core CPI at 2.5%, and monthly CPI at 0.2%, with softer inflation likely to support silver by reducing pressure on Treasury yields and the dollar.
Producer prices and consumer data will also matter. Core PPI is forecast at 0.3%, PPI at 0.2%, and unemployment claims at 202K, followed by retail sales at 0.1% and core retail sales at 0.2%. A weaker growth and inflation combination could strengthen the case for lower rates, supporting the silver price.
The 10-year Treasury auction, crude oil inventories and University of Michigan sentiment data add more potential volatility. The preliminary consumer sentiment reading is forecast at 54.4, with inflation expectations at 4.2%, so stronger yields or inflation fears could limit silver’s upside.
Here’s What the Silver Chart Is Showing
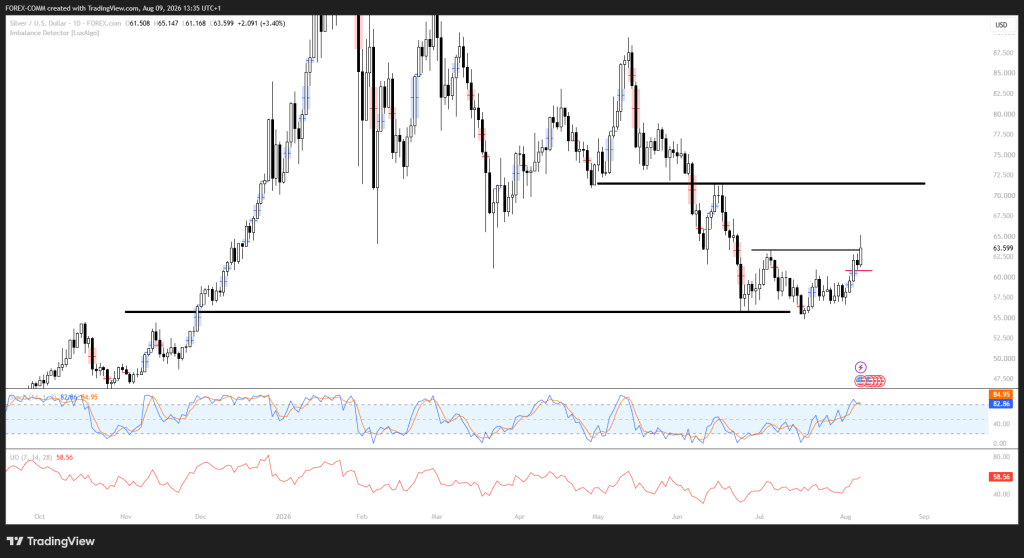
We had a look at the chart and found the price recovering from the $55.80 monthly PD array, which acted as a major support zone during the latest decline. From there, the silver price pushed up to $63.60, hitting that big weekly wall around $63.
 Source: Tradingview.com
The latest rally has moved the price past the short-term hurdle near $61, but that $63–$64 zone is still the main test. The chart shows silver got turned away from this area before, so if it can close a daily candle above it, buyers might have a clear shot at the next major level.
Momentum looks good, but the stochastic oscillator is already up at 82.86, with its signal line at 84.95. That means if buyers can’t break through $63–$64, silver could be due for some sideways action or a pullback.
The Ultimate Oscillator is at 58.56, keeping momentum above the neutral area. If the $63 resistance holds, the first downside area is the $58-$60 daily zone; if that support holds, the broader structure could send the silver price toward the $71 monthly objective.
Related Silver Price: Gold and Silver Prices Pumping Again: Here’s Why
Where Will Silver Price Go This Week?
Bullish case:
A daily close above $63-$64 could confirm that buyers have cleared the weekly obstacle. In that case, the silver price could target $65-$67, with $71 as the larger monthly objective.
Neutral case:
If $63-$64 continues to reject buyers, the silver price could consolidate between $58 and $63. Holding the $58-$60 daily support would keep the broader recovery intact.
Bearish case:
A failure to hold $58 would weaken the setup and bring the $55.80 monthly PD array back into view. Losing that level could open the door toward $52-$50.
Frequently Asked Questions
What is the silver price prediction for this week
Silver could target $71 if it breaks and holds above the $63 resistance zone. A rejection could send the silver price back toward $60–$58.
What is driving the silver price this weekThe main drivers are U.S. inflation data, Treasury yields, the U.S. dollar, and Federal Reserve rate expectations. Softer CPI or PPI data could support silver by reducing expectations for higher rates.
Can silver price reach $71 this weekYes, but the silver price first needs to clear the $63 weekly resistance and hold above it. If $58–$60 remains strong as support after any correction, the path toward $71 becomes more credible.
Subscribe to our YouTube channel for daily crypto updates, market insights, and expert analysis.
The post Silver Price Prediction for This Week (August 10-16) appeared first on CaptainAltcoin.