Silver is selling off again on October 29, falling almost 3% toward the low-$52 area and erasing much of the stability it showed around the Federal Reserve meeting. The latest Kitco three-day
Silver is selling off again on October 29, falling almost 3% toward the low-$52 area and erasing much of the stability it showed around the Federal Reserve meeting.
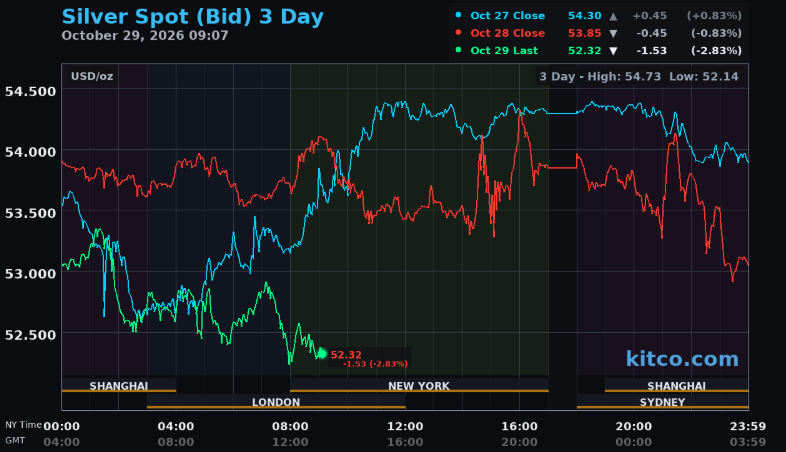
The latest Kitco three-day chart shows silver near $52.32, down roughly $1.53, or 2.8%, during Thursday’s session.
That puts XAG/USD close to the lowest point of the three-day window, around $52.14, after trading as high as roughly $54.73.
The failure to hold above $54 is important because silver had several chances to stabilize there.
Instead, sellers returned almost immediately.
The Chart Shows Momentum Breaking Down Again
The three-day chart tells me something interesting…
Silver closed October 27 near $54.30.
It slipped slightly to around $53.85 on October 28.
Then the selling accelerated on October 29, pushing price toward $52.30.
The key feature is not only the size of Thursday’s decline.
 Source: X/@silvertrade
It is where the decline began.
Silver repeatedly struggled around the $54.20-$54.50 area during the previous sessions. Every attempt to build momentum above that region faded.
Once price moved below approximately $53.50, the decline accelerated.
For me, $52 is now the immediate level to watch, but the larger psychological level is still $50.
A move below $50 would change the tone considerably because that region has been viewed as one of the strongest potential support areas after silver’s earlier rally.
Below that, $45 becomes the next larger zone.
Why Silver Is Falling After the Fed Pause
The Federal Reserve kept interest rates unchanged on Wednesday, but that did not produce the relief rally some precious-metals traders expected.
The reason is that the Fed pause did not mean the tightening story was finished.
September PCE inflation rose 0.5% month over month, stronger than the previous 0.3% reading, and markets are still pricing a high probability of another Fed hike in December. Reuters reported that the probability was around 83% after the latest inflation data.
That is difficult for silver.
Higher expected rates raise the opportunity cost of holding a non-yielding asset, and elevated real yields can keep speculative demand weak.
Silver is also more exposed than gold to industrial conditions.
Reuters noted this week that silver continues to face pressure from high interest rates, softer solar-panel demand, substitution in manufacturing, ETF outflows and cautious investor sentiment.
That helps explain why silver has failed to benefit meaningfully even when gold finds some defensive demand.
$50 Is Becoming the Bigger Test
The current decline does not necessarily mean silver is heading directly toward $45.
But the room for bulls is shrinking.
If $52 holds, silver could still attempt another recovery toward $53.50 and then $54-$55.
If $52 gives way, $50 becomes the obvious next psychological target.
A break below $50 would be more serious because it would show that buyers are no longer defending a level that has attracted attention throughout the correction.
The broader macro environment also remains uncomfortable. U.S. inflation is still elevated, Treasury yields remain high, and the Fed has left the door open to more tightening.
So I would not treat Thursday’s move as an isolated bad session.
Silver is again showing that it cannot sustain rebounds when macro pressure returns.
The immediate battle is around $52.
The larger one is still $50.
If buyers fail there as well, the correction could become considerably deeper.
Subscribe to our YouTube channel for daily crypto updates, market insights, and expert analysis.
The post Silver Price Today: Silver Crashes 3% as Post-Fed Selling Returns appeared first on CaptainAltcoin.