SIREN price prediction interest is climbing as the token grinds lower inside a tightening pattern for the past couple of days, and the kind of structure it is grinding inside matters a lot he
SIREN price prediction interest is climbing as the token grinds lower inside a tightening pattern for the past couple of days, and the kind of structure it is grinding inside matters a lot here.
Falling wedges have a habit of resolving upward once they compress enough, and this coin looks like it is getting close to that decision point.
The levels discussed below come from the 1-hour SIREN perpetual chart and reflect a short-term view.
If the price closes meaningfully outside the ranges mentioned here, this price prediction would need to be rechecked against the updated chart.
SIREN Price Right Now
Metric
Value
Current Price (CMP)
$0.03114
24-Hour Change
-7.4% (-$0.002489)
Market Cap
$23.51M
Futures Volume (24h)
$27.11M
Spot Volume (24h)
$167.14K
Open Interest
$25.07M
Circulating Supply
723.85M
Total Supply
723.85M
Max Supply
Not applicable
Open interest here sits at $25.07M against a market cap of just $23.51M, which is unusually high for a coin this size.
That gap points to heavy leveraged positioning relative to spot activity, and it is a big part of why the liquidation numbers below carry extra weight in this SIREN technical analysis.
Chart source: TradingView, SIREN/TetherUS Perpetual Contract, Binance, 1 hour timeframe, captured 11 August 2026, 04:12 PM IST (10:42 AM UTC). Data source: CoinGlass, SIREN market page, captured 11 August 2026, 04:12 PM IST.
Methodology and Data Sources
The chart structure in this piece comes from an independent reading of the SIREN 1 hour perpetual chart on Binance, covering the falling wedge and the horizontal levels marked on it.
Volume, open interest, and supply figures are pulled from CoinGlass. Liquidation totals and the exchange volume and holder breakdowns further down also come from CoinGlass.
Where SIREN Trading Volume and Supply Are Concentrated
A couple of fresh data points add useful context beyond the chart itself.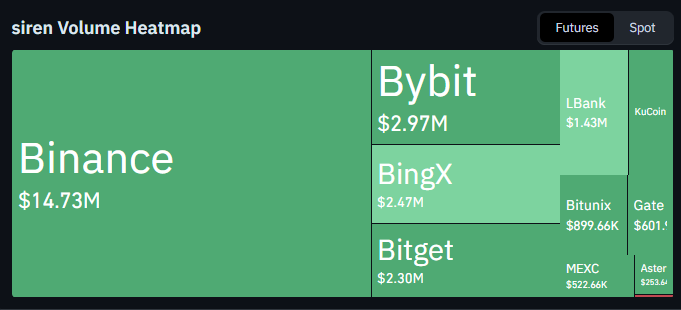
On the futures side, Binance dominates SIREN trading with $14.73M of volume, well ahead of Bybit at $2.97M, BingX at $2.47M, and Bitget at $2.30M.
Smaller pockets of activity sit on LBank, Bitunix, MEXC, and a handful of other venues.
The holder distribution tells its own story. The largest single address, labelled Binance Alpha 2.0 Router Proxy, holds 38.8% of supply, while a burn or null address accounts for another 27.6%.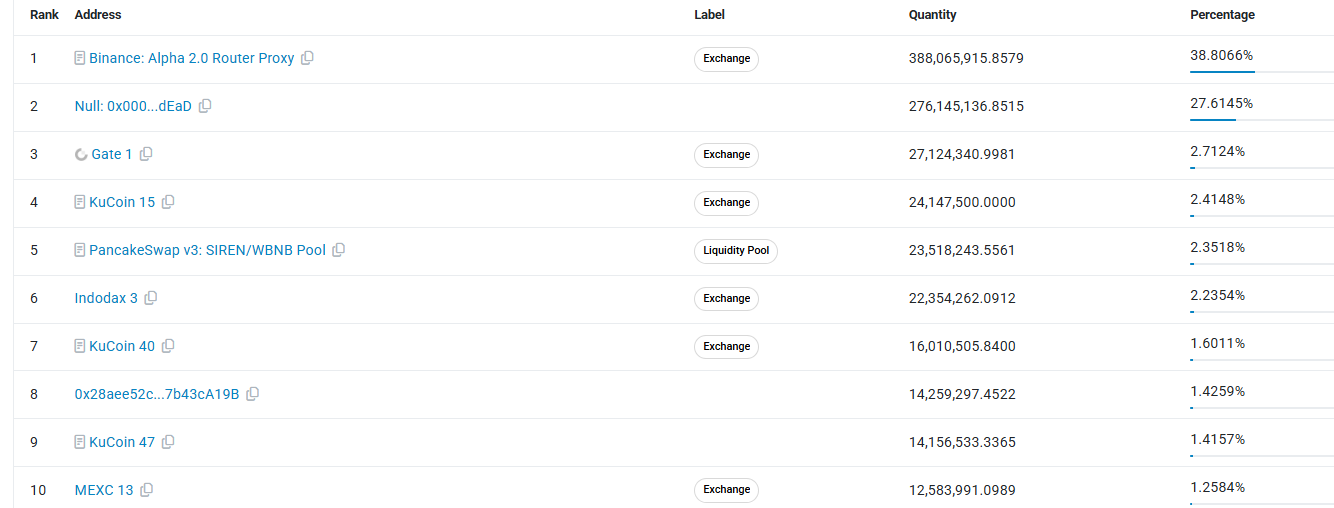
Together those two alone cover close to two-thirds of the total supply.
Beyond that, the remaining top ten addresses are almost entirely exchange wallets, including Gate, KuCoin, Indodax, and MEXC, alongside a PancakeSwap liquidity pool holding a bit over 2%.
This kind of concentration is worth keeping in mind for anyone building a longer-term SIREN crypto forecast, since a large share of circulating supply sits in a small number of exchange-controlled or dormant addresses rather than being widely distributed.
Liquidation Data Today
Liquidation flow on SIREN has flipped between longs and shorts depending on the window, which is worth noting for this SIREN breakout analysis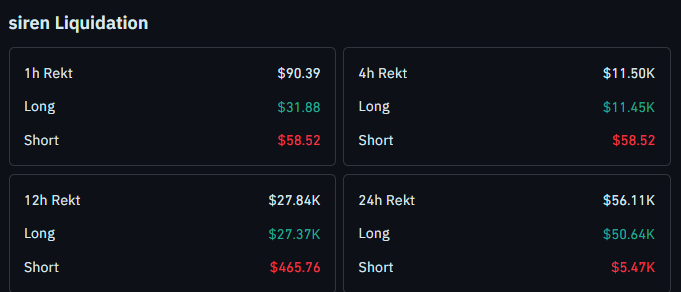 .Over the last hour, total liquidations came to $90.39, with $31.88 from longs and $58.52 from shorts.
The 4 hour figure jumps sharply to $11.50K, made up of $11.45K in longs against the same $58.52 in shorts carried over from the shorter window.
Over 12 hours, rekt totals reach $27.84K, with $27.37K from longs and just $465.76 from shorts.
The 24-hour number climbs to $56.11K, split between $50.64K in longs and $5.47K in shorts.
Longs have clearly taken the heavier hit over the last day, which fits a coin that has been sliding lower inside its wedge and catching leveraged buyers on the way down.
Source: CoinGlass, SIREN liquidation data, captured 11 August 2026.
SIREN Trend and Momentum: Key Takeaways
SIREN is trading at 0.03114, currently compressing inside a falling wedge pattern
A close above 0.03257 would confirm a wedge breakout, with 0.03737 as the first upside target
A sustained move higher could extend toward 0.03938 next
A close below 0.03005 would instead point to further downside, with 0.02780 as the next support
Open interest exceeds SIREN's market cap, meaning leveraged flow has an outsized influence on near-term price swings
Leveraged positions around any of these zones carry real liquidation risk, as the data above shows. These are chart-based levels, not guarantees.
SIREN Price Prediction: 1-Hour Chart Analysis
Coin is currently compressing inside a falling wedge on the 1 hour chart, a pattern that typically forms as selling pressure fades even while price keeps making lower highs and lower lows within a narrowing range.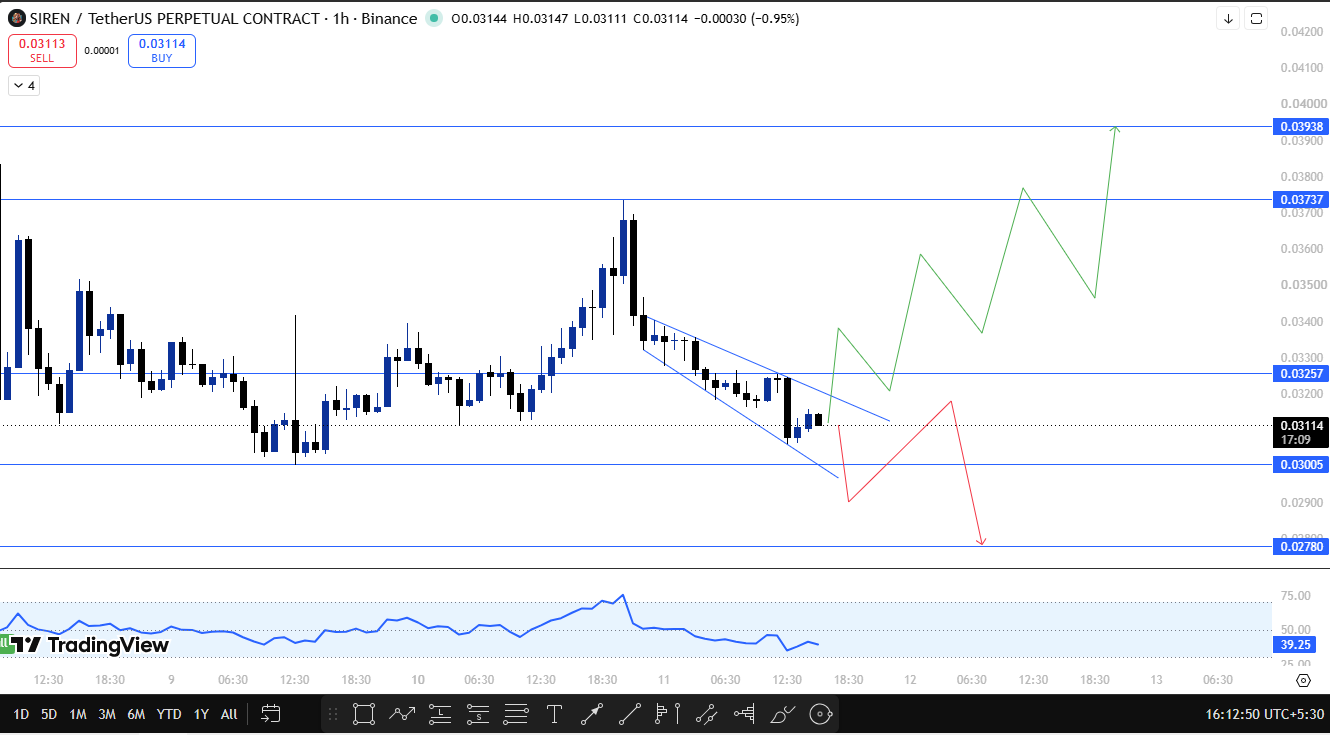
That narrowing is exactly what has been happening here over the last day or so.
The key trigger in this SIREN price prediction sits at 0.03257.
A confirmed close above that level would mark a break out of the wedge structure, and the first target from there is 0.03737, roughly 20% above CMP.
If that move carries through with follow-up strength, 0.03938 comes into view next, close to 26.4% above the current price.
On the other side, the wedge losing its lower boundary would tell a different story. A close below 0.03005, about 3.5% under CMP, would suggest the compression is resolving downward instead of up, and the next support to watch becomes 0.02780, roughly 10.8% below CMP.
Given how thin SIREN's spot volume is relative to its futures activity, moves in either direction here can happen quickly once one of these trigger levels gives way.
SIREN Technical Outlook Snapshot
Indicator
Signal
Price Structure
Falling wedge, price compressing near the lower boundary
Momentum Oscillator
Reading near 39.25, below the midpoint
Immediate Bias
Neutral to cautious below 0.03257
Bullish Trigger
1H close above 0.03257
Bearish Trigger
1H close below 0.03005
Invalidation
1H close below 0.03005
Support and Resistance Levels to Watch
Type
Level
Note
% From CMP
Resistance
$0.03938
Extended wedge breakout target
+26.4%
Resistance
$0.03737
First target on wedge breakout
+20.0%
Resistance
$0.03257
Falling wedge breakout trigger
+4.6%
Current Price
$0.03114
Live CMP
0%
Support
$0.03005
Wedge breakdown trigger
-3.5%
Support
$0.02780
Next support if 0.03005 breaks
-10.8%
Risk-Reward Table
Case
Trigger
Target
Bullish breakout
1H close above 0.03257
0.03737, then 0.03938
Bearish breakdown
1H close below 0.03005
0.02780
Setup invalidation
1H close below 0.03005
Falling wedge resolves lower instead of higher
Invalidation Level
This price prediction treats a 1-hour close below 0.03005 as invalidation for the wedge breakout thesis. Below that mark, the compression pattern would be resolving downward rather than up, shifting focus toward 0.02780 instead.
Given how concentrated SIREN's leveraged open interest is relative to its market cap, moves through either 0.03257 or 0.03005 could liquidate a large share of positioned traders quickly, adding volatility beyond what the chart pattern alone would suggest.
How Bitcoin Could Influence SIREN
A coin this small tends to amplify whatever the broader market is doing, so Bitcoin's own direction matters here.
A steady or rising Bitcoin would give SIREN a better shot at clearing 0.03257 and following through toward 0.03737.
A risk off market, by contrast, would make a slide under 0.03005. more likely, particularly given how thin spot liquidity is relative to the futures market.
Planned Update
This price prediction will be revisited if price closes an hourly candle beyond either 0.03257 or 0.03005, or if no clear resolution happens within the next 24 hours of trading.
A large liquidation event or a sudden shift in exchange volume concentration would also be reason to update this outlook sooner.
Glossary
Falling Wedge: A technical pattern formed by two converging downward-sloping trendlines, often signaling a potential bullish reversal once price breaks above the upper line.
Open Interest: The total value of outstanding futures or perpetual contracts that have not yet been settled or closed.
Liquidation: The forced closure of a leveraged trading position by an exchange when losses erode the trader's margin below a required threshold.
Holder Concentration: The degree to which a coin's circulating supply is held by a small number of wallets or addresses, often used as a gauge of distribution risk.
Invalidation Level: The price point at which a technical setup or forecast is considered no longer valid, prompting a reassessment of the outlook.
CoinGabbar's Technical Analyst View
Bull Case: Price closes above 0.03257, confirming the falling wedge has broken to the upside, with price extending toward 0.03737 and potentially 0.03938.
Base Case: Price keeps compressing between 0.03005 and 0.03257 without a decisive close on either side, extending the wedge pattern a little longer.
Bear Case: Price closes below 0.03005, signaling the wedge is resolving downward, with price sliding toward 0.02780 next.
Disclaimer
This price prediction is prepared for informational purposes only and should not be treated as financial or investment advice. Cryptocurrency markets, including SIREN, are highly volatile, and leveraged trading carries a significant risk of loss, including the risk of liquidation as shown in the data above. Readers should conduct their own research and consult a qualified financial advisor before making any investment decisions. CoinGabbar and the analyst preparing this piece do not hold a position at the time of publication.