SIREN Price Signal Before the Next Explosion The price chart alone doesn't explain SIREN right now. It shows a token that spiked to $0.1113, fell back to the $0.032–$0.047 range, and looks, o
SIREN Price Signal Before the Next Explosion
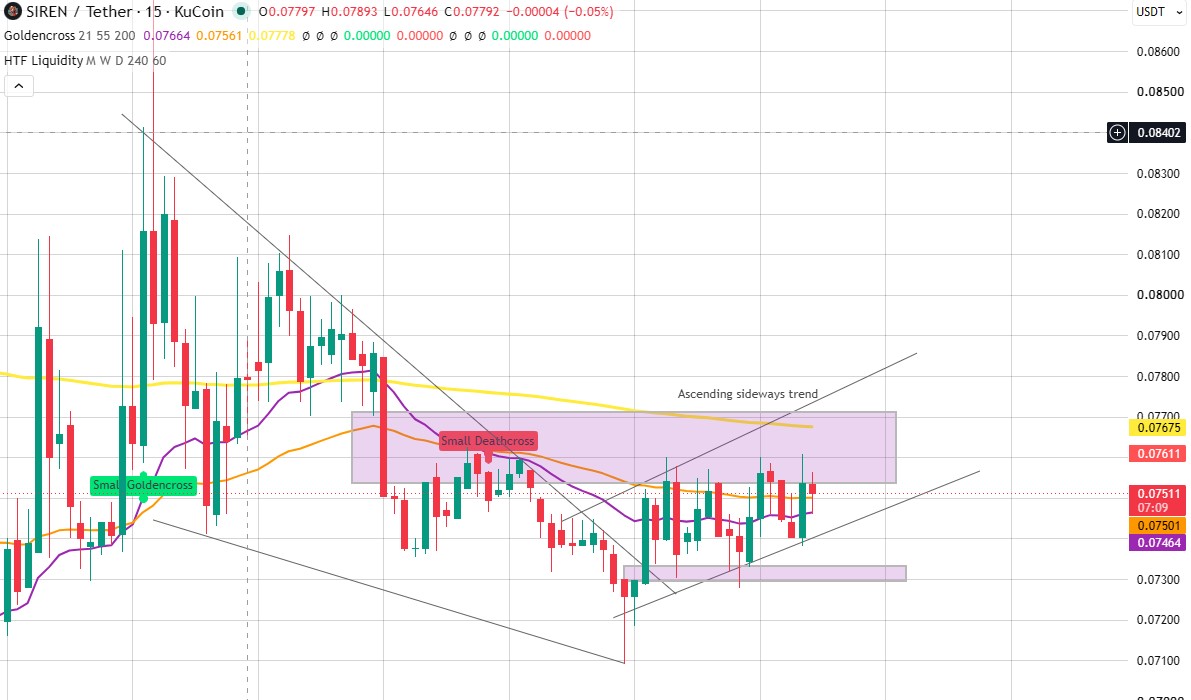
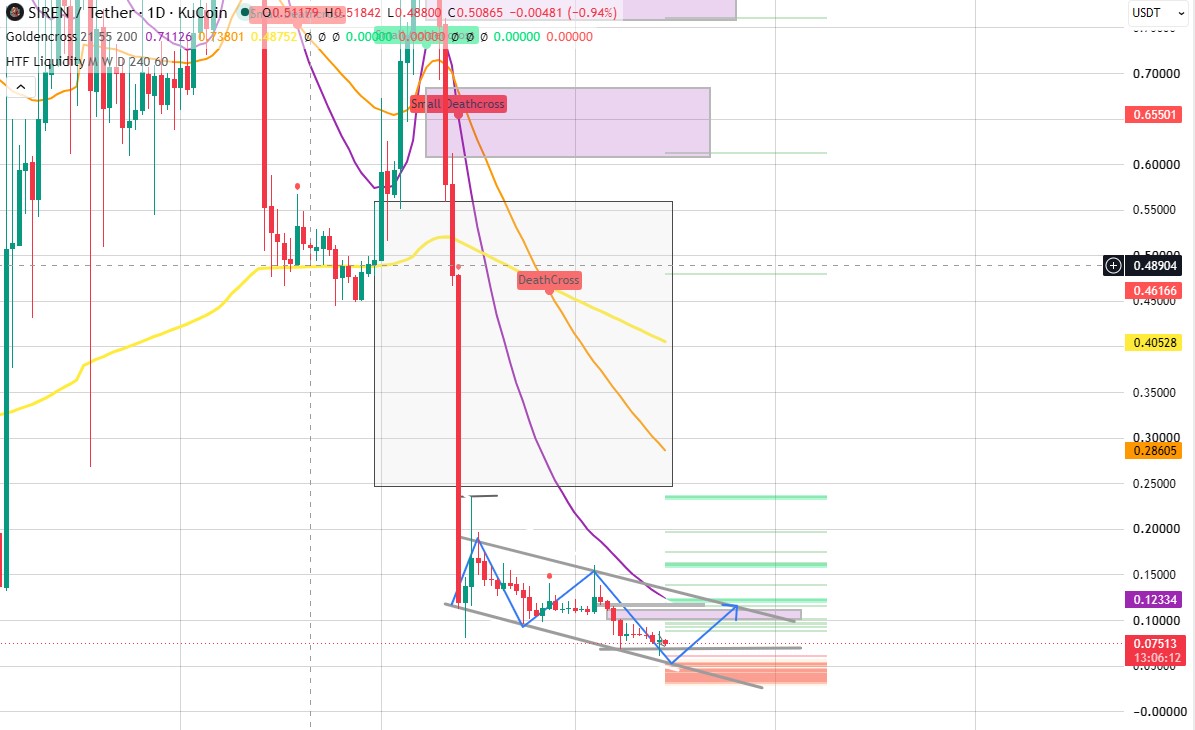
The price chart alone doesn't explain SIREN right now. It shows a token that spiked to $0.1113, fell back to the $0.032–$0.047 range, and looks, on the surface, like a rally that failed.
What the chart doesn't show is a pattern that's now shown up ahead of at least two, and arguably three, of this token's biggest moves this year: small,
newly funded wallets quietly buying in a tight price band before the chart does anything dramatic. That pattern is active again right now, in the same $0.032–$0.05 zone SIREN currently trades in.
This piece explains what the signal actually is, why it's genuinely worth watching, and why it has fooled people before.
On-chain trackers have documented hundreds of newly funded wallets accumulating small, consistent amounts of SIREN in the $0.032–$0.05 range,
a structural pattern on-chain researchers have flagged as identical to the accumulation phases that preceded SIREN's cycle-two and cycle-three pump events earlier this year.
That accumulation is happening again today, at current depressed prices, even as SIREN's headline price action looks like a failed recovery.
Separately, at least one specific on-chain buy, 500,000 SIREN purchased for roughly $144,000 USDT, has been flagged in recent tracking as exactly the kind of size and timing that has preceded prior moves.
Here's the honest complication: this exact signal has appeared before every SIREN pump this year, and also before at least one move that fizzled without much follow-through. It's a real, trackable pattern, not proof of what happens next.
The Insider Data: What the Accumulation Pattern Actually Looks Like
Signal
Detail
Accumulation zone
$0.62–$0.078, the same range SIREN is trading in as of today
Wallet profile
Hundreds of newly funded wallets, buying small, consistent amounts rather than one or two large purchases
Historical precedent
Structurally identical pattern documented ahead of SIREN's pre-cycle-two and pre-cycle-three pump phases earlier in 2026
Specific flagged transaction
500,000 SIREN purchased for approximately $144,000 USDT by a single on-chain address, tracked in recent monitoring
Whale cluster status
Still holding roughly 595.7 million SIREN, over 80% of supply; no large transfer to exchange wallets confirmed
Momentum indicator context
Stochastic RSI has shown oversold rebounds in recent sessions, though this indicator has produced false signals during SIREN's broader downtrend before
The reason this qualifies as a genuinely 'hidden' signal rather than something visible on a standard price chart is simple: none of this shows up as a dramatic candle.
Small, distributed wallet accumulation doesn't move price the way a single large buy does, which is exactly why it tends to go unnoticed until after the fact, when a pump has already started and people look backward to explain it.
Why This Signal Cuts Both Ways
The uncomfortable truth about this pattern is that it doesn't distinguish between two very different scenarios. Scenario one: genuine retail and mid-size investors recognizing value at depressed prices, slowly building positions ahead of a real recovery.
Scenario two: the same controlling entities behind SIREN's four documented pump-and-dump cycles this year are using fresh wallets to quietly re-accumulate supply at the bottom, setting up a fifth engineered cycle.
Both scenarios produce the exact same on-chain footprint: distributed small buys in a tight price range. There is no way to distinguish them from wallet data alone.
What can help narrow it down, though imperfectly, is watching whether these newly funded wallets show any connection to addresses previously associated with the core whale cluster.
Something on-chain researchers continue to investigate but haven't conclusively resolved as of this writing.
Until that connection is either confirmed or ruled out, the responsible read is that this signal is real and worth tracking, not that it's proof of an imminent explosion in either direction.
What Happened the Last Time This Signal Appeared
● Ahead of the June 19 bounce: similar small-wallet accumulation was documented before SIREN's roughly 150% single-day surge, a move multiple analysts later characterized as short covering and momentum trading rather than organic, sustained recovery.
● Ahead of the July 11 recovery attempt: comparable accumulation preceded the push from roughly $0.038 to the seven-day high near $0.1113, a move that has since fully round-tripped back down.
● In both cases, the accumulation signal correctly preceded a real, sharp price move. In neither case did that move prove durable beyond a handful of sessions.
● The pattern's track record so far in 2026: reliable for predicting that a move is coming, unreliable for predicting whether that move sticks.
Facts: SIREN
Metric
Current Reading
Current Price (approx.)
$0.032–$0.076
Accumulation Zone (active now)
$0.032–$0.086
Flagged On-Chain Buy
500,000 SIREN for $144,000 USDT
Whale Cluster Holdings
595.7 million SIREN, 80%+ of circulating supply
Confirmed Whale-to-Exchange Transfer
None as of writing
Prior Signal Accuracy (move prediction)
Preceded both the June 19 and July 11 moves
Prior Signal Accuracy (durability)
Neither prior move held beyond a handful of sessions
True All-Time High / Low
$3.61 / $0.02635
Technical Analysis
Indicator
Current Reading
Signal
Accumulation pattern
Active in $0.072–$0.082 zone
Historically precedes a sharp move, direction and durability unconfirmed
Stochastic RSI
Recent oversold rebound
Supports a short-term bounce case, but has produced false signals in this downtrend before
Directional Movement Index
Still favoring sellers per recent tracking
Broader trend structure remains bearish despite the accumulation signal
Whale wallet activity
No confirmed exchange-bound transfer
The most important condition still unresolved
Key resistance
$0.085, then $0.095–$0.111
Levels a genuine breakout would need to clear
SIREN Price Prediction: Bear, Base, Bull, and Extreme Bull Scenarios
These scenarios explicitly account for the accumulation signal's mixed historical track record, treating it as a reason to watch closely rather than a reason to assume a specific outcome.
Scenario
Next 7 Days
End of 2026
Key Condition
Bear Case
$0.065–$0.075
$0.63–$0.95
Accumulation turns out to be cycle-five setup; whale cluster eventually routes tokens to exchanges
Base Case
$0.058–$0.086
$0.05–$0.11
Accumulation continues without a clear breakout either way; range-bound consolidation persists
Bull Case
$0.085–$0.10
$0.09–$0.14
Accumulation proves organic; sustained volume carries price back toward the $0.095–$0.111 zone
Extreme Bull
$0.11+
$0.18–$0.28
Newly funded wallets confirmed unrelated to the core whale cluster, alongside verified concentration reduction
Risk & Opportunity Matrix
Risks
Opportunities
The exact same accumulation pattern has preceded two moves this year that both later failed to hold
The pattern has a real, documented track record of preceding sharp price moves, whatever the eventual durability
No way currently exists to confirm whether new wallets are linked to the core whale cluster
No confirmed whale-to-exchange transfer through the entire recent round trip, still the most encouraging absence
Directional Movement Index still favors sellers despite the accumulation signal
The specific $144,000 flagged purchase suggests at least some conviction-sized buying at current levels
Whale cluster still holds over 80% of supply regardless of what smaller wallets do
A confirmed break in the link between fresh wallets and the whale cluster would meaningfully upgrade this signal's reliability
YMYL Disclaimer: This article covers cryptocurrency, a Your Money or Your Life (YMYL) subject. It is for informational purposes only and does not constitute financial, investment, or legal advice. SIREN's documented history of extreme, whale-driven volatility and concentrated ownership makes it exceptionally high-risk, including the possibility of rapid, near-total loss of value. Always conduct independent research and consult a licensed financial advisor before making investment decisions.