SIREN price prediction is back in focus after the coin quietly extended the gains from last SIREN price forecast to almost 20%. $SIREN had been moving in a steady trend for days, but the late
SIREN price prediction is back in focus after the coin quietly extended the gains from last SIREN price forecast to almost 20%.
$SIREN had been moving in a steady trend for days, but the latest price action has started telling a very different story.
The move everyone expected never really arrived, and that unexpected shift is exactly what has traders watching this chart more closely now.
$SIREN Price Right Now
Metric
Value
Price
$0.03143
24h Change
+1.29% (+$0.0004009)
Market Cap
$27.81M
Futures Volume (24h)
$18.35M
Spot Volume (24h)
$931.74K
Open Interest
$26.59M
Circulating Supply
724.05M SIREN
Total Supply
724.05M SIREN
Max Supply
Not Disclosed
Source:SIREN price on CoinGlass, as of July 23, 2026. Figures may vary slightly across other tracking websites.
$SIREN Liquidation Data Today (July 23, 2026)
The liquidation picture over the past day tells a fairly one-sided story. In the last hour, only $22.12 was wiped out, and every dollar of it came from longs, with nothing taken from shorts.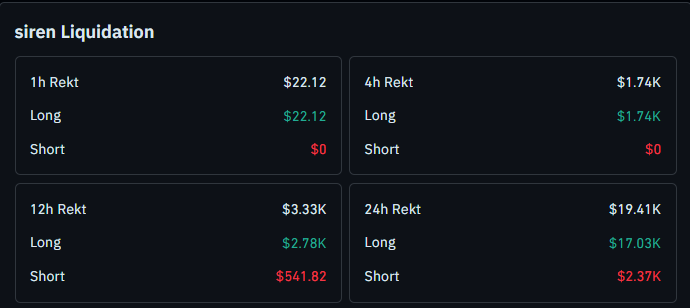
Zoom out to the 4-hour window and the total climbs to $1.74K, again entirely from long positions.
Over 12 hours, total liquidations sit at $3.33K, made up of $2.78K in longs and $541.82 in shorts.
Across the full 24-hour window, the number grows to $19.41K, with $17.03K coming from longs and $2.37K from shorts.
Traders betting against this move have been getting burned repeatedly, and that kind of long-side liquidation pattern usually means buyers are absorbing supply faster than the market expects.
You can track this in real time throughSIREN liquidation data here.
$SIREN Holder Distribution And Whale Concentration Overview
Ownership on SIREN is concentrated, and it is worth knowing before reading too much into any single candle. 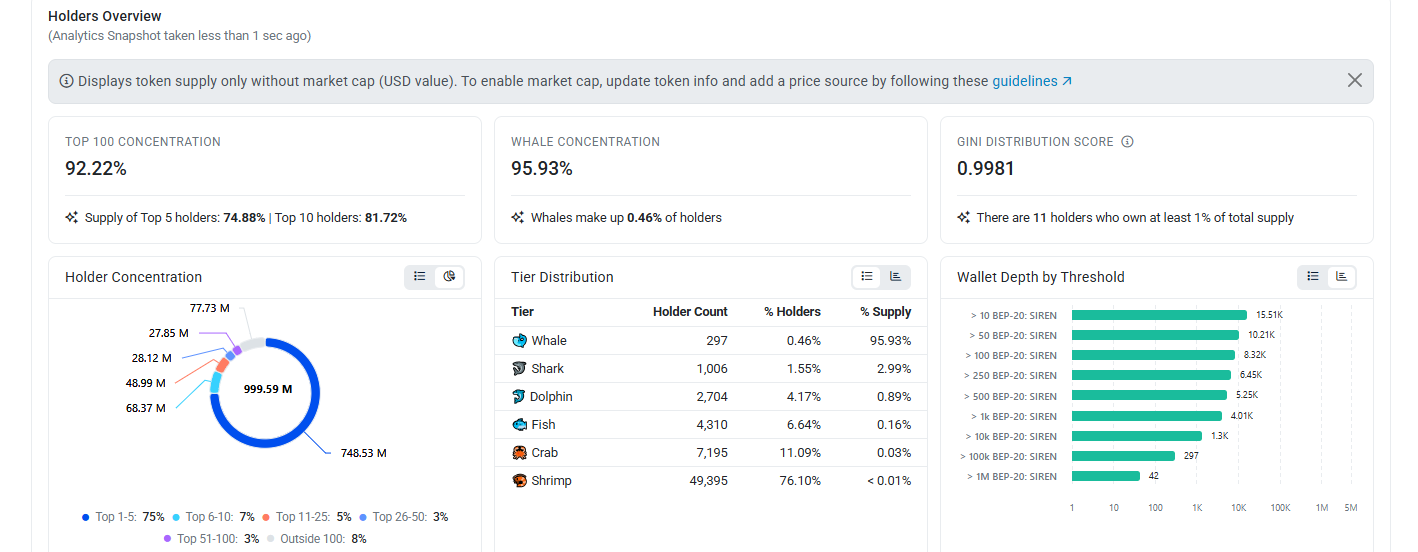
The top 100 wallets hold 92.22% of the total supply, and whale wallets alone, which are just 0.46% of all holders, control 95.93% of the coin.
The Gini distribution score sits at 0.9981, and only 11 wallets currently own at least 1% of total supply each.
Retail participation is broad but thin, with shrimp wallets making up over 76% of all holders while owning less than 0.01% of the supply between them.
This kind of setup means large wallets can move price fast in either direction, which lines up with the sudden green candle visible earlier on the chart. Anyone can verify this directly throughSIREN holder data on BscScan.
Why Is $SIREN's Price Holding Up After Breaking The Wedge
$SIREN spent the past several sessions climbing inside a well-defined rising wedge, with price respecting both the upper and lower boundary on repeated occasions.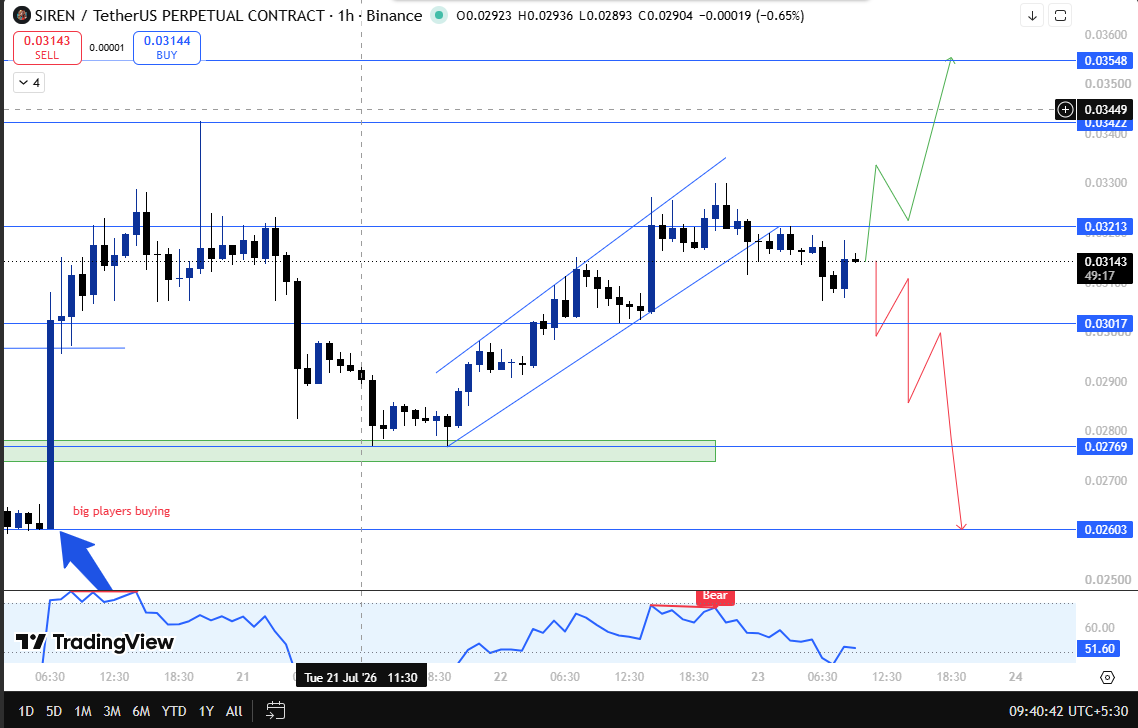
Big buying showed up early in that move, and the wedge has been broken downside; since then, the coin has been grinding higher, currently sitting near $0.03143.
Once the price broke the wedge, the usual expectation was a fast price fall back down, the kind of move that punishes late buyers who chased the breakout.
That has not happened here. Instead of collapsing, SIREN has been consolidating just under resistance of $0.03213, and selling attempts have looked weak rather than aggressive.
This is very similar to what played out in our lastSIREN ascending triangle setup coverage, where price also refused to give up ground after breaking structure.
If SIREN manages to break and close above $0.03213, that opens the door toward the next resistance levels at $0.03422 and then $0.03548.
On the other side, if price breaks down and closes below $0.03017, the setup weakens and the next support levels to watch become $0.02769 and $0.02603.
$SIREN Support And Resistance Levels To Watch This Week
Type
Level
Note
Resistance 2
$0.03548
Extended upside target
Resistance 1
$0.03422
Immediate resistance on breakout
Breakout Trigger
$0.03213
A confirmed close needed above this
Current Price
$0.03143
Holding near breakout zone
Support 1
$0.03017
Key level to hold
Support 2
$0.02769
First downside target on breakdown
Support 3
$0.02603
Deeper downside support
This lines up closely with levels flagged in our earlierSIREN next rally prediction piece, where the same support band was already being watched as a line in the sand.
Risk-Reward Table For This $SIREN Price Setup
Case
Trigger
Target
Bull Case
Confirmed close above $0.03213
Move toward $0.03422 and $0.03548
Bear Case
Confirmed close below $0.03017
Slide toward $0.02769 and $0.02603
Invalidation Level For This Bullish $SIREN Structure
For this setup to keep working, SIREN needs to hold above $0.03017 on a closing basis.
A confirmed close below that level would break the current structure and shift the picture toward the downside, with $0.02769 and $0.02603 becoming the next levels in play.
Historical Context: How The Last $SIREN Call Played Out
This is not the first time SIREN has shown this kind of stubborn strength.
Our earlier coverage on theSIREN turning point article flagged a similar refusal to break down, and price has since climbed close to 20% from those levels.
What makes the current move stand out is that a rising wedge breakout is normally followed by a fast reversal, and that reversal has simply not shown up, even with sellers repeatedly testing the current zone.
SIREN Price Prediction Glossary For New Traders
Rising Wedge: A price structure formed by two parallel upward-sloping lines, with price bouncing between them as it trends higher.
Liquidation: What happens when a leveraged trade gets forcibly closed because the trader ran out of margin to keep it open.
Whale Concentration: The percentage of total token supply held by the largest wallets, used to gauge how easily price can be moved by a small group of holders.
Gini Distribution Score: A measure of how evenly or unevenly a token supply is spread across holders, where a score closer to 1 means heavy concentration.
Open Interest: The total value of derivative positions like futures that are still open and have not been closed out.
Expert View On SIREN Price Prediction
SIREN breaking out of its rising wedge without the usual sharp pullback is the most important thing happening on this chart right now.
Weak selling pressure at a level that should have triggered a fast reversal suggests buyers are still in control, even after a near 20% run from the last call, as covered in ourhidden signal before explosion analysis.
As long as $SIREN holds above $0.03017, the path of least resistance stays tilted toward $0.03422 and possibly $0.03548.
A confirmed close below $0.03017 would be the clearest sign that momentum has shifted, opening the door toward $0.02769 next.
Disclaimer: This article is for informational purposes only and should not be considered financial advice. Cryptocurrency markets are highly volatile, and price predictions are not guaranteed. Please do your own research before making any investment decisions.